
Figure 6.
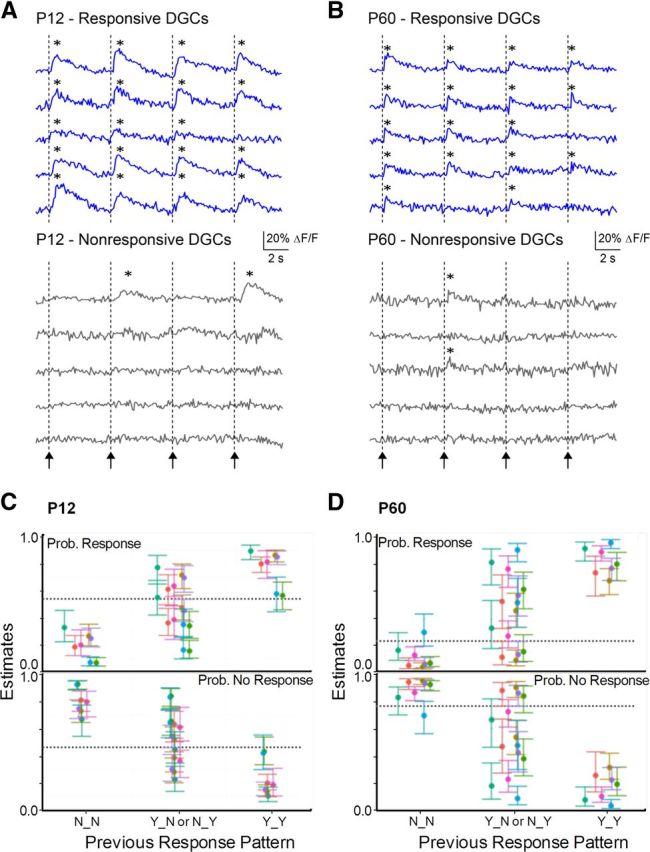
Repeatability of activate/remain silent DGC response. A, B, Calcium transient traces in representative DGCs in P12 and P60 animals, respectively, in response to 4 PP stimuli. Arrows/dotted lines indicate onset of PP stimulation (400 μA). Responsive cells (A, B, top) were defined as DGCs that activated to the first stimuli, and nonresponsive cells as DGCs that failed to activate to the first stimulus (A, B, bottom). Responsive cells at both ages responded frequently to subsequent stimuli, whereas nonresponsive cells did not. *Calcium transient was detected. C, D, Estimate of probability of response or nonresponse in Stimulus 4 given the previous pattern of response in Stimuli 2 and 3 for P12 (C) and P60 (D) groups (see Materials and Methods for model details). N_N, no response in both; Y_N, response in Stimulus 2 and not Stimulus 3; N_Y, no response in Stimulus 2 but response in Stimulus 3; Y_Y, response to both. Error bars indicate SEM; each color indicates a different slice. The hyphenated line indicates the probability of a response at Stimulus 4 across all cells and slices. The activation behavior of both P12 and P60 DGCs was strongly influenced by their previous behavior: cells that exhibited responses to Stimuli 2 and 3 had a high probability of activating to Stimulus 4, whereas cells that did not activate to Stimuli 2 and 3 had a low probability of responding to Stimulus 4, in all slices (n = 7 for both P12 and P60) and at both developmental stages. Cells with mixed responses to Stimuli 2 and 3 (Y_N or N_Y) had variable probabilities of activating to Stimulus 4. Random behavior would be predicted by responses probabilities at the overall population mean (dotted line in plot).