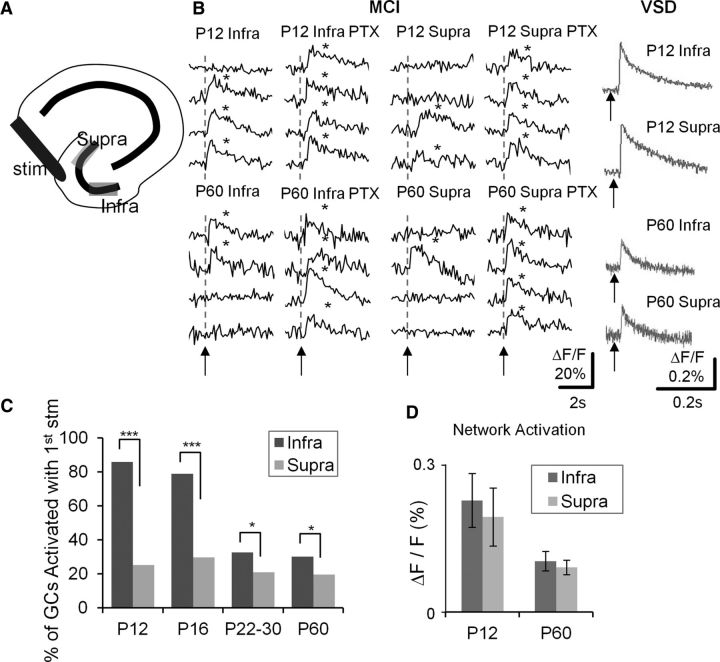
Figure 8.
Enhanced proportional activation of DGCs in the infrapyramidal blade of the DG. A, Schematic depicting the hippocampus with the suprapyramidal and infrapyramidal blades. B, Traces are calcium imaging responses from representative DGCs in the infrapyramidal (Infra) and suprapyramidal (Supra) blade of the DG, in P12 (top) and P60 (bottom) animals. Responses were recorded in control medium, and in the presence of the GABA antagonist, PTX (50 μm). Gray traces (right) represent VSDI responses of PP-evoked EPSPs in the infrapyramidal and suprapyramidal blades of P12 (top) and P60 (bottom) animals. Asterisks denote detection of a calcium transient. Note that there is enhanced proportional activation of DGCs in the infrapyramidal compared with the suprapyramidal blades at both ages, despite the fact that VSDI-recorded EPSPs were comparable. C, Aggregate population plots of percentage DGC activation in infrapyramidal and suprapyramidal blades in 4 developmental ages (P12, P16, P22–P30, and P60). Note that enhanced DGC activation is evident at all ages. *p < 0.05 (Fisher's exact test). ***p < 0.001 (Fisher's exact test). P12: n = 10 samples of 2 animals; P16: n = 10 of 2; P22–P30: n = 20 of 3; P60: n = 24 of 4. D, Averaged VSDI-recorded PP-evoked EPSPs in P12 and p60 animals. Note that there was no difference between the infrapyramidal and suprapyramidal blades (P12, n = 7 slices of 2 animals; P60, n = 6 of 1).

