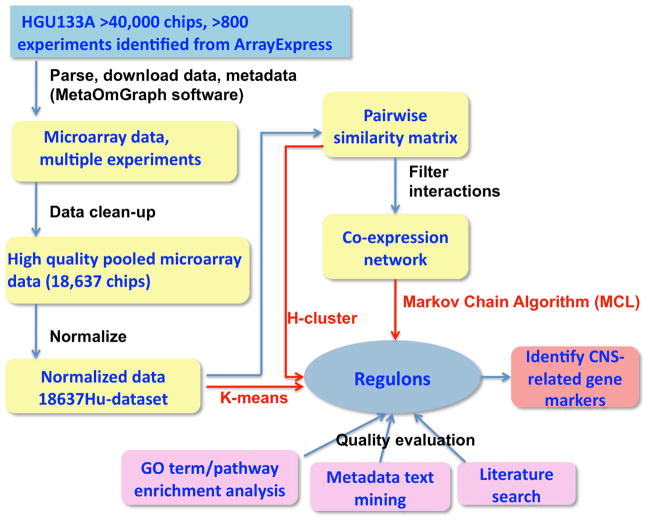
Fig. 1.
Flowchart for deriving regulons from large amounts of transcriptomic data. Microarray transcriptomic data from over 40,000 chips and associated metadata were downloaded using MetaOmGraph software (MOG). After data clean-up, normalization, and creation of a pairwise similarity matrix for all genes, K-means, H-cluster, and MCL clustering methods were applied to derive regulons (red arrows). The quality of the resultant regulons was evaluated by GO term or pathway enrichment analysis, metadata text mining, and literature search. Based on the low GS scores of the MCL derived regulons (Fig. 2) and further parameter optimization (Fig. 3 and 4), the 18637Hu-co-expression-network partitioned by MCL was selected for a proof of concept analysis.

