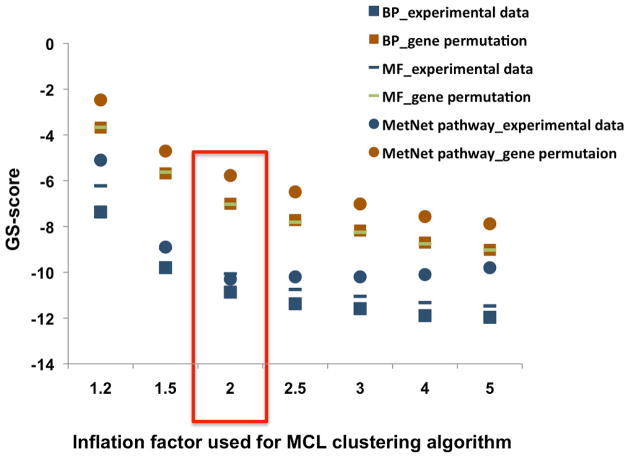
Fig. 3.
GS-scores from experimental data and gene permutation tests at inflation factors from 1.2 to 5. An inflation factor of 2 maximizes the difference between GS-scores of experimental data and the gene permutation tests. BP (biological process from Gene Ontology); MF (molecular function from Gene Ontology).

