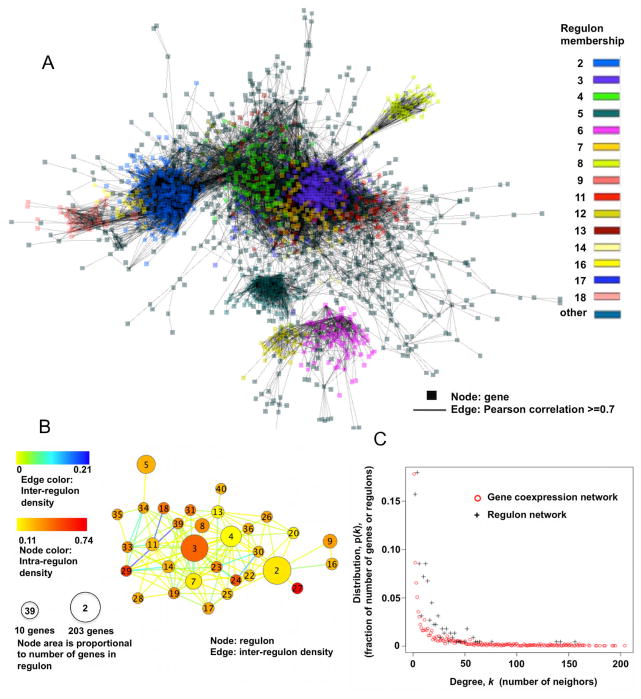
Fig. 5.
Human co-expression network.
(A) Gene to gene co-expression network (18637Hu-co-expression-network). The biggest connected component is shown. Nodes represent genes and edges represent co-expression (Pearson correlations ≥ 0.7). This figure provides a visual depiction of the 18637Hu-co-expression-network.
(B) Regulon to regulon co-expression network. Regulons from the 18637Hu-co-expression-network are represented as nodes, and the connections between genes in different regulons as edges (Pearson correlation ≥ 0.7). The 40 largest regulons contained in (A) are shown. Density is determined by Equations 5 and 6 (Methods). Regulon numbers, assigned in descending order of regulon size (genes/regulon), are written within nodes. This figure provides a visual depiction of regulon to regulon co-expression network.
(C) Number of neighbors versus size distribution for the gene co-expression and regulon networks. Both networks show power-law connectivity distribution, indicating that the co-expression network and the reduced regulon networks are both small-world networks.

