
Fig. 6.
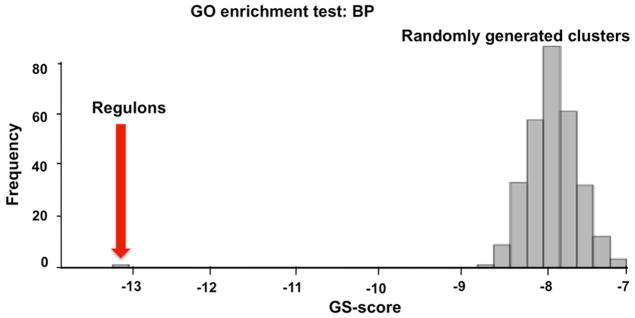
Statistical evaluation of MCL clustering. The GS-score here represents the mean of 40 log-transformed best adjusted p-values for the most overrepresented Gene Ontology (GO) terms in biological process branch corresponding to the 40 experimentally-based regulons with 10 or more gene members (red arrow). The GS-score for regulons derived from experimental data (red arrow) is compared to the analogous values for 268 randomly generated sets of 40 clusters (histogram). The GS-score of regulons from experimental data is better than any of the randomly obtained clusters. BP: biological process.