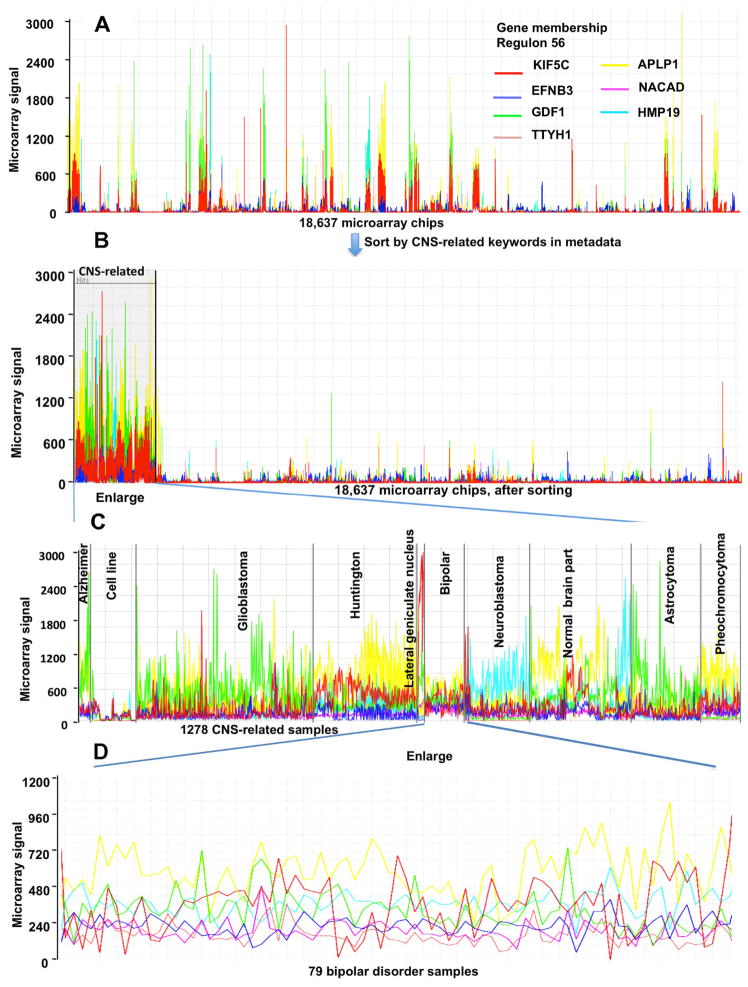
Fig. 9.
The microarray signal of genes in Regulon 56 across 18,637 HGU133A chips, and within the subset of the 1,278 CNS-related chips. Analyzed and visualized using MetaOmGraph (MOG) software. The MOG software and associated human co-expression data is publicly available at (http://metnet.vrac.iastate.edu/MetNet_MetaOmGraph.htm). This global analysis using interactive software illustrates the potential of visualization of regulons in the context of a large transcriptomic network derived from high quality co-normalized data for hypothesis development.

