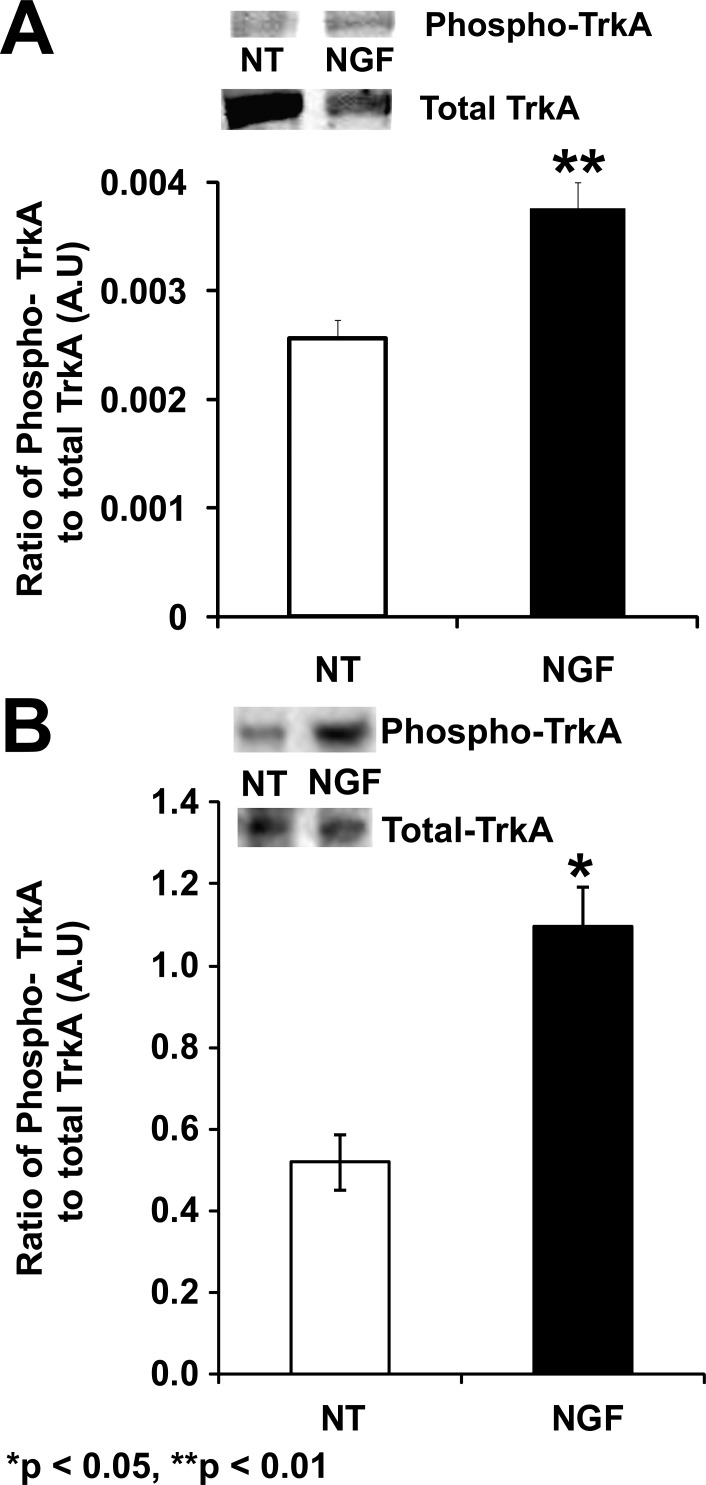
Figure 2.
Phosphorylation of TrkA in CD34+ cells and HREC following NGF treatment. CD34+ cells (A) and HRECs (B) were either nontreated (NT) or treated with 3 pM NGF for 1 minute and protein expression was evaluated. Bars represent ratio of integrated optical density of phosphorylated TrkA to total TrkA. Data were analyzed by Student's t-test and represented as mean ± SE (n = 3). Asterisks indicate significant difference compared with control (NT).

