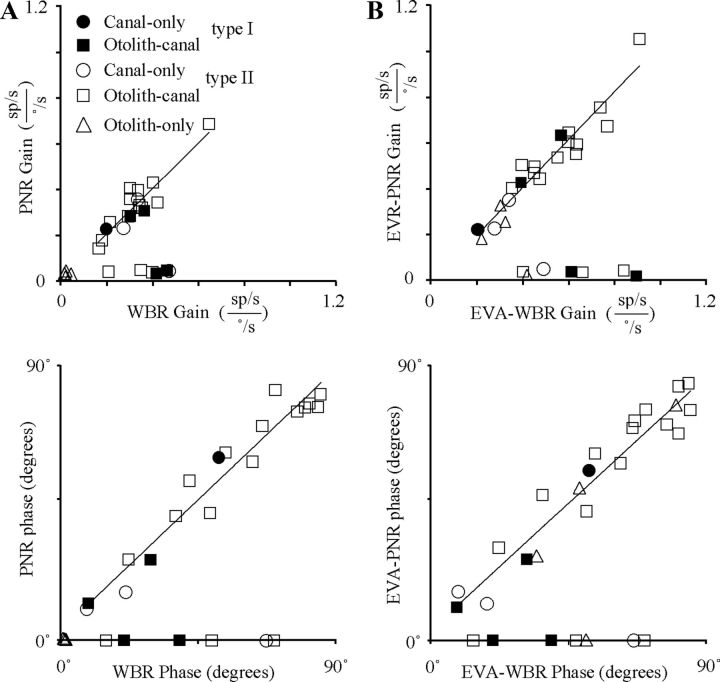
Figure 6.
Comparison of neck proprioceptive and vestibular sensitivities. A, Top, Gain during PNR as a function of the gain during WBR. Bottom, Relative phase during PNR as a function of the relative phase during WBR. Relative phase was computed by subtracting 180° from both the WBR and PNR response phase if the WBR response phase was >180°. In both graphs, linear fits are shown superimposed upon the population of IN neurons having both WBR and PNR responses with significant gains (>0.1 sp/s/°/s). Linear fits: Top, gpnr = 0.99*gwbr + 0.001, R2 = 0.85 and bottom, θpnr = 0.95*θwbr + 2.54, R2 = 0.95. B, Top, Gain during EVA-PNR as a function of the gain during EVA-WBR. Bottom, Relative phase during EVA-PNR as a function of the relative phase during EVA-WBR. In both right-side graphs, linear fits are shown superimposed upon the population of IN neurons having both EVA-WBR and EVA-PNR responses with significant gains (>0.1 sp/s/°/s). Linear fits: top, geva-pnr = 1.04*geva-wbr + 0.01, R2 = 0.92 and bottom, θeva-pnr = 0.92*θeva-wbr + 3.55, R2 = 0.93.

