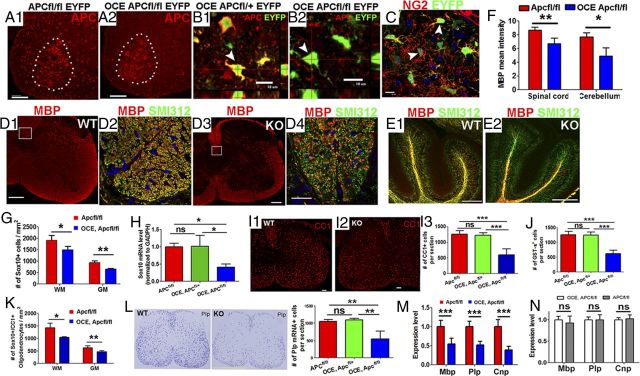
Figure 2.
Apc disruption results in hypomyelination and inhibition of oligodendrocyte differentiation. Tamoxifen was injected in OCE/Apcfl/fl pups and littermates at P6 and P7 (see Materials and Methods) and CNS tissues were analyzed as indicated. A1, A2, APC staining in P14 OCE/Apcfl/fl, EYFP (KO), and Apcfl/fl, EYFP (WT) mice showing most APC+ cells in the spinal WM were absent in KO mice. Dotted areas delineate APC+ motor neurons in the ventral horn. B1, B2, EYFP expression as a surrogate for APC disruption. C, EYFP expression in NG2+ OPCs in the spinal cord of OCE/Apcfl/fl, EYFP mice on P8. D1–E2, MBP (myelin) and SMI312 (axons) double IHC showing hypomyelination in spinal cord (D1–D4) and cerebellar WM (E1, E2) at the level of confocal microscopy on P14. Boxed areas in D1 and D3 (corticospinal tract) are shown at higher power in D2 and D4, respectively. Note many SMI312+/MBP− unmyelinated axons in KO (compare D4 with D2). F, Quantifications of MBP mean density (n = 4 spinal cord, n = 3 cerebellum) in spinal cord and cerebellum. G, Densities of Sox10+ oligodendroglial lineage cells in WM and GM of spinal cord (n = 10 in WT, n = 7 in KO). H, MRNA levels of Sox10 in P14 Apc WT (Apcfl/fl, n = 10), one-allele KO (OCE/Apcfl/+, n = 4), and two-allele KO (OCE, Apcfl/fl n = 7) spinal cord. I1–I3, Representative confocal images and quantification of CC1 immunostaining on P14 spinal cord (n = 10, 4, and 7, respectively). J, GST-π+ oligodendrocytes per section in each genotype of P14 spinal cord (n = 10, 4, and 7, respectively). K, Densities of Sox10+/CC1+ oligodendrocytes in the WM and GM of P14 spinal cord in Apcfl/fl (n = 10) and OCE/Apcfl/fl (n = 7) mice. L, Representative images showing Plp in situ hybridization and the number of Plp mRNA+ cells per section in P14 Apcfl/fl (n = 10), OCE/Apcfl/+ (n = 4), and OCE/Apcfl/fl (n = 7) mice. M, MRNA levels of Mbp, Plp, and Cnp in P14 Apcfl/fl (n = 10) and OCE, Apcfl/fl (n = 7) spinal cord. N, MRNA levels of Mbp, Plp, and Cnp in P14 Apcfl/fl (n = 5) and OCE/Apcfl/fl (n = 4) spinal cord without tamoxifen treatment (no Apc deletion). Scale bars: A1, A2, D1, D3, E1, E2, I1, I2, 50 μm; B1–C, D4, 10 μm; L, 500 μm.

