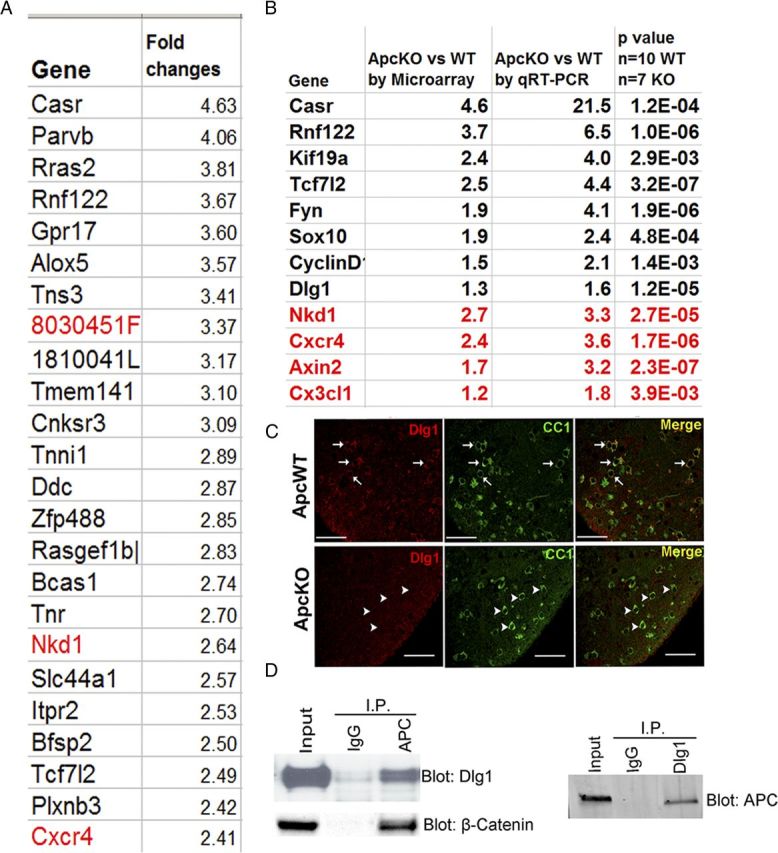
Figure 9.

Genes with altered expression derived from microarray data analysis and their validations. A, Representative top 24 genes with altered expression upon Apc ablation (red, upregulated in Apc KO) mediated by Olig2-Cre-ERT2 with tamoxifen treatment at P6 and P7 and analysis at P14. B, Comparison and validation of microarray profile dysregulated genes by qRT-PCR. C, To provide validation at the protein level, double IHC showing that DLG1 protein expression was barely detectable in CC1+ oligodendrocytes in P14 Apc-KO (OCE/Apcfl/fl) (arrowheads), whereas there was robust expression in WT mice (Apcfl/fl) (arrows). Tamoxifen was injected at P6 and P7. D, Coimmunoprecipitation indicating APC and DLG1 physically interact with each other, with β-catenin as a positive control, using protein extracted from day 2 OPC cultures. Scale bars, 50 μm.
