Figure 2.
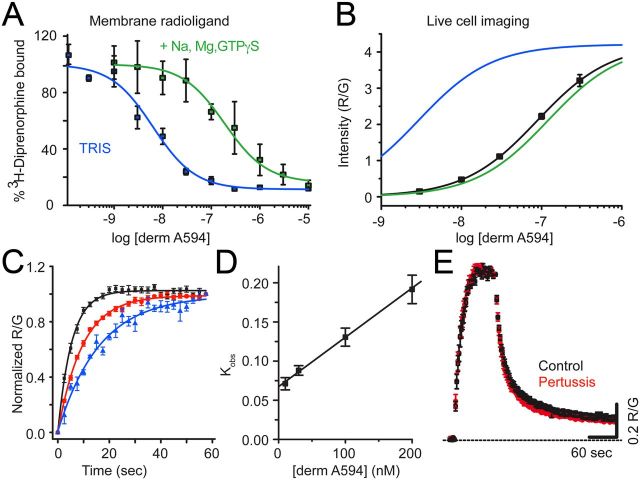
derm A594 binding to FLAG-MOR in live cells is relatively low affinity. A, Steady-state displacement of [3H]diprenorphine (0.2 nm) with increasing concentrations of derm A594 (0–10 μm) from FLAG-MOR HEK 293 cell membranes was measured in Tris alone (blue) or Tris with Na+, Mg2+, and GTPγS (green) and fit with one site nonlinear regression to define high- and low-affinity binding of derm A594 to FLAG-MOR. The best fit of the data are plotted. Average of 3 experiments performed in duplicate. B, Steady-state binding of derm A594 in live FLAG-MOR HEK 293 cells was relatively low affinity. Cells were incubated in stated concentrations of derm A594, imaged, and relative fluorescence intensity was measured. Data were fit with the Hill equation, and the best fit is plotted (black); n = 5–11. High- and low-affinity binding curves from [3H]diprenorphine competition binding experiments shown in A are overlaid in blue and green, respectively, using the Ki values from competition binding experiments and the slope and R/Gmax values from steady-state whole-cell derm A594 binding to simulate expected results. C, Kinetics of derm A594 binding. derm A594 was applied at 10 (blue), 30, 100 (red), and 200 nm (black), and the apparent association rates were determined by fitting to a single exponential decay function. For display, binding was normalized relative to the amount of derm A594 bound at the end of the 1 min period and averaged results are plotted; n = 4–6. D, Linear fit of the apparent association rate from average data in C plotted as a function of derm A594 concentration. The plotted line has a slope of 612,000 mol−1 s−1 and an intercept of 0.068 s−1, giving a calculated Kd of 110 nm. E, Binding and unbinding kinetics were unaffected by pertussis toxin treatment. Cells were either untreated (black) or treated with pertussis toxin (red) (100 ng/ml, overnight). derm A594 (100 nm) was applied for 90 s at the indicated time and rapidly washed. Data are mean ± SEM (ctrl, n = 6; pertussis toxin, n = 5).

