Figure 2.
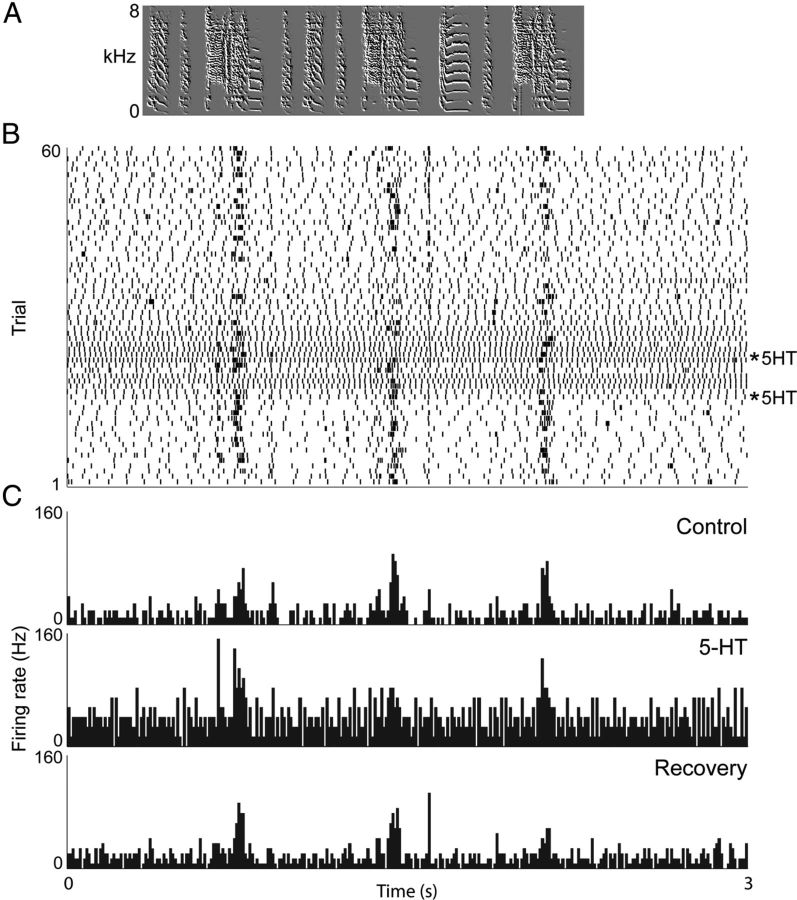
Example of in vivo spiking patterns in RA projection neurons with 5-HT application and BOS presentation. Neurons fired more in general, and also fired more song-related spikes during bursts. A, Waveform and spectrogram of BOS. All panels are aligned to A. B, Raster plot of spikes from an RA projection neuron selective for BOS. 5-HT was applied at the 2 asterisks. C, Histogram of spike activity from control, 5-HT and recovery periods.

