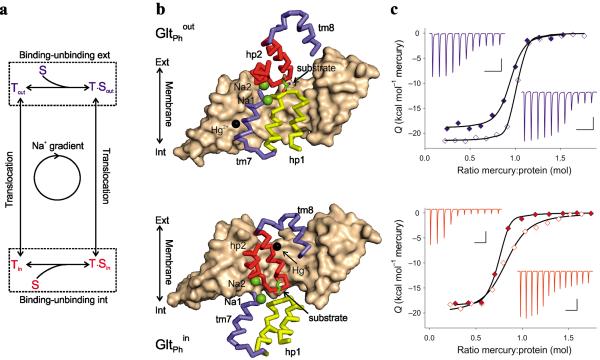
Figure 1. Constraining GltPh in the outward and inward facing states.
(a) Schematic representation of the transport cycle. The dashed boxes highlight the substrate (S) binding/unbinding equilibria on the extracellular and intracellular sides of the membrane. (b) The crystal structures of single protomers of GltPhout (top) and GltPhin (bottom) cross-linked with Hg2+. Trimerization domains are shown in surface representation and colored wheat. Interfacial regions of the transport domains are shown as ribbons with the remainder of the transport domain omitted for clarity. TMs 7 and 8 are colored blue, HP1 yellow and HP2 red. Bound substrates are shown as sticks and ions are emphasized as spheres with Na+ colored green and Hg2+ black. (c) ITC analysis of Hg2+ binding at 25 °C to GltPh L66C S300C (top) and GltPh K55C A364C (bottom). Shown are Hg2+ titrations of the apo transporters in the presence of 1 mM Na+ (open symbols) and Asp-bound transporters in the presence of 10 mM Na+ and 0.2 mM Asp (solid symbols) transporters. The black lines through the data are the best fits to the independent binding sites model with parameters listed in Supplementary Table 2. The Hg2+ binding thermal powers are shown in the upper (Asp-bound) and lower insets (apo) with the bar scales indicating 0.1 μcal/sec and 500 sec in vertical and horizontal directions, respectively.

