
Figure 6. Temperature dependence of the binding energies.
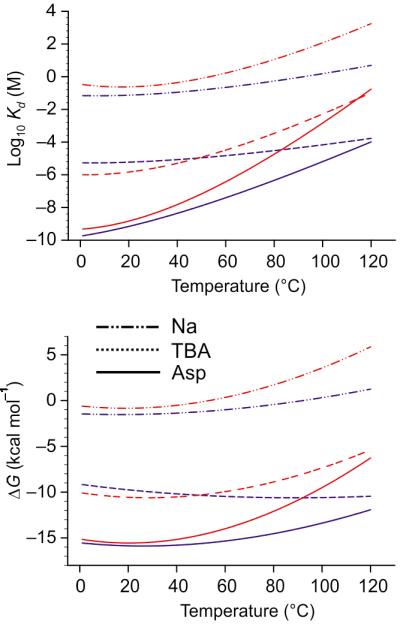
Shown are the temperature extrapolations of the binding free energies (top) and dissociation constants (bottom) for the outward (blue) and inward (red) facing states. Shown are the extrapolations for binding of 3 Na+/Asp (solid lines) and 2 Na+/TBA (broken lines) and for Na+ (dotted line). The KDs for binding of Asp and TBA were calculated at 100 mM Na+.