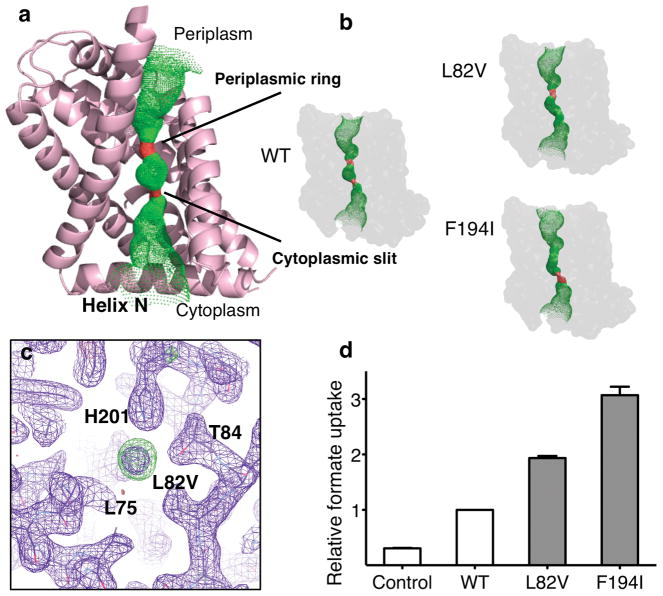
Fig 3.
Structural and functional characterization of the ion permeation pathway. a, Structure of a protomer of HSC overlaid with the pore diameter calculations from HOLE, colorized to indicate the radius of water, where green is permeable to water and red is impermeable. Transmembrane helix-2 has been removed for clarity. b, Pore diameter calculations from HOLE of the crystal structures for each of the two permeation pathway mutations, Leu82Val and Phe194Ile and wild-type (WT). c, Close up of the electron density observed at the selectivity filter for the Leu82Val mutant. Purple is the 2Fo – Fc electron density map contoured at 1.1σ and green is the Fo – Fc difference density map contoured at 3σ. d, Relative uptake of proteoliposomes reconstituted with purified HSC protein and pathway mutations. The bar graph represents the 10-minute time point of each concentrative uptake experiment. Error bars represent s.e.m. (N = 3).

