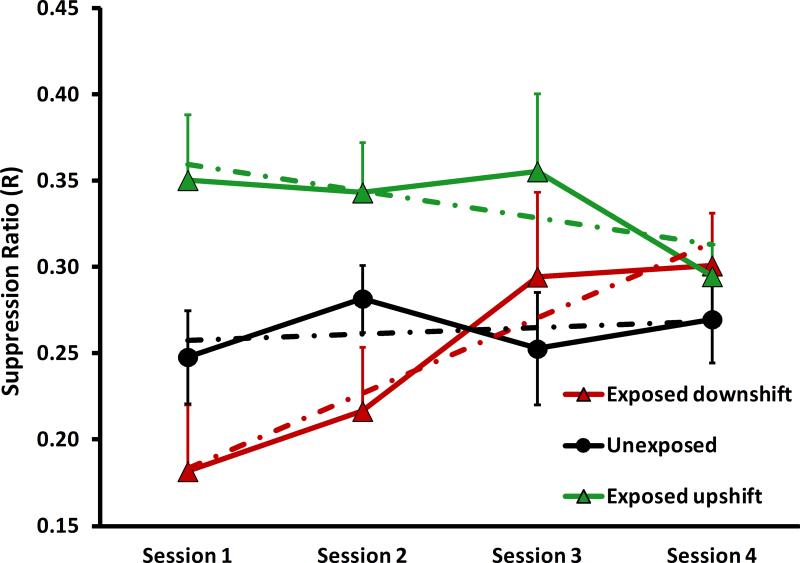
Figure 10.
Mean 20 kHz time series performance across lidocaine treatment sessions, of the groups depicted in Fig. 9. Downshifted data reflected tinnitus, while upshifted data indicated hyperacusis with tinnitus. Error bars show the standard error of the mean. Broken lines show the least-mean-square regression line for each function. As treatment progressed, the psychophysical evidence of both tinnitus and hyperacusis, progressively decreased.

