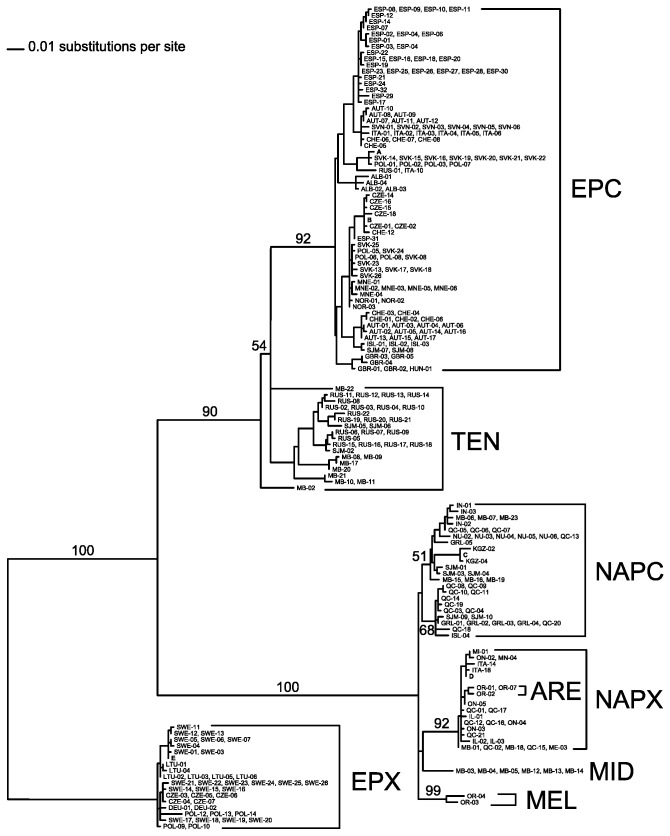
Figure 3. A mitochondrial DNA gene tree inferred by maximum likelihood from the sequences of ND5 haplotypes.
Numbers along branches indicate the percent bootstrap frequencies for major bipartitions. Haplotypes carried by many individuals are represented by a letter as follows: A, SVK-01, SVK-03, SVK-04,SVK-05, SVK-06, SVK-07, SVK-09, SVK-10, SVK-11 and SVK-12; B, CZE-09, CZE-10, CZE-11, CZE-19, CZE-20, POL-11, CHE-09, CHE-10, CHE-11 and DEU-03; C, KGZ-01, KGZ-03, KGZ-05, KGZ-06, KGZ-07 and KGZ-08; D, ITA-06, ITA-07, ITA-08, ITA-09, ITA-11, ITA-12, ITA-13, ITA-15, ITA-16, ITA-17, ITA-19, ITA-20, ITA-21, ITA-22 and ON-01; E, GBR-06, GBR-07, GBR-08, SWE-02, SWE-08, SWE-09 and SWE‑10.

