
Fig. 9.
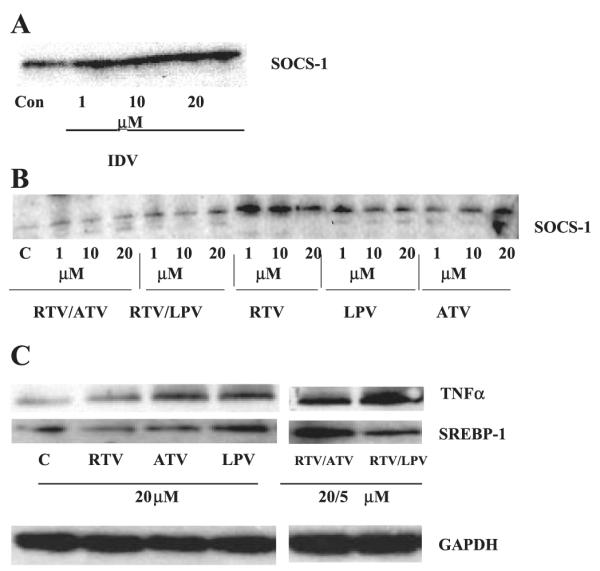
SOCS-1, TNF-α, and SREBP-1 expression in L6 myotubes and 3T3-L1 adipocytes exposed to HIV-protease inhibitors. A: 3T3-L1 adipocytes were exposed to IDV for 1, 15, and 24 h at 37°C and 10% CO2-90% O2. B: L6 myotubes were exposed to 1, 10, and 20 μmol/l RTV/ATV, RTV/LPV, RTV, LPV, and ATV at 37°C, 5% CO2-95% O2 for 3 h. C: L6 myotubes were exposed to protease inhibitors alone (RTV, ATV, and LPV; 20 μM) or incombination (RTV/ATV, RTV/LPV; 20 μM ATV and LPV; 5 μM RTV). IDV, indinavir; RTV, ritonavir; LPV, lopinavir; ATV, atazanavir. Each lane represents the combination of 3 wells from a 12-well culture plate. Corresponding GAPDH control bands are shown below.