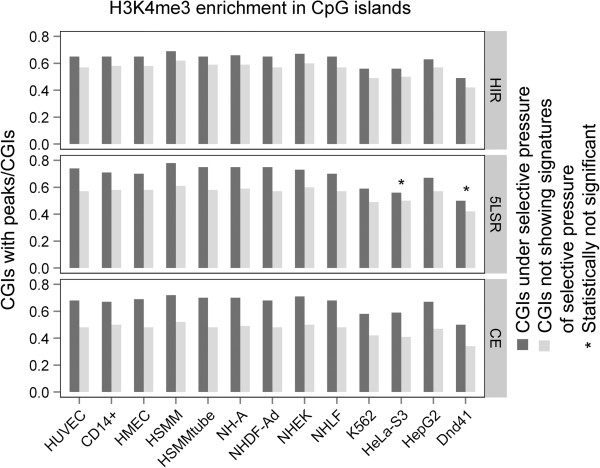
Figure 1.
Enrichment of H3K4me3 modification in CpG islands under selective pressure. Black bars represent the fraction of CGIs containing histone modification marks within regions that show signatures of natural selection (HIRs, CEs and 5LSRs). Grey bars represent the fraction of CGIs containing histone modification marks within regions that do not show signatures of selective events. The X-axis indicates the analyzed cell lines. An asterisk (*) above a bar indicates a statistically non-significant difference.

