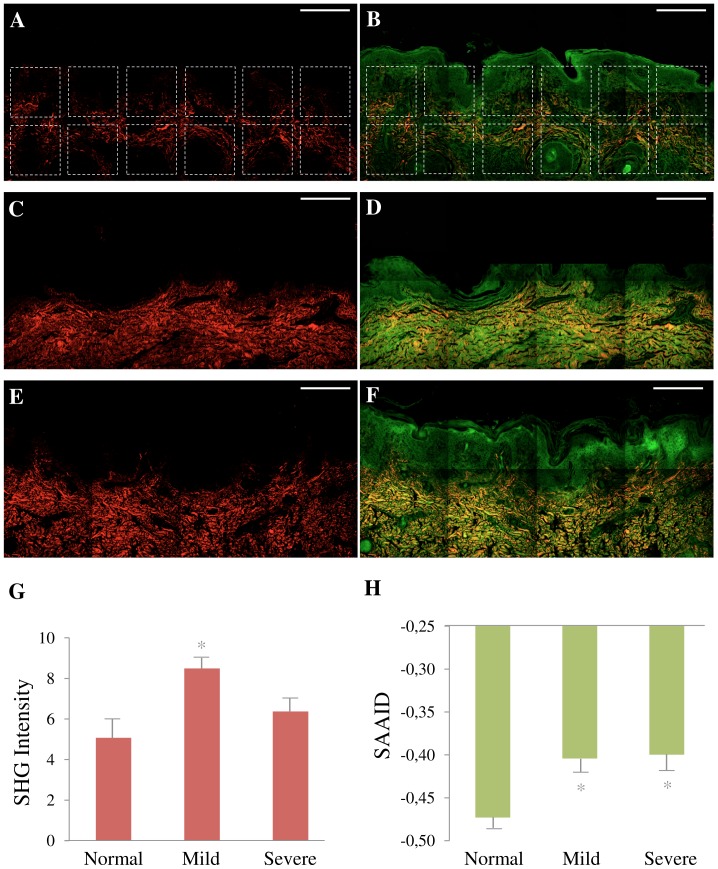
Figure 3. Quantification of collagen and elastic tissues.
Montage of SHG (A, C, E) red and TPEF+SHG (B, D, F) green and red images. Representative images of fixed normal skin from control (A, B), Type I OI patient (C, D) and Type III OI patients (E, F). Scale bar = 200 µm. Montage A and B shows the 12 ROI (200×200 µm) selected to perform the quantification of SHG intensity (G) and SHG autofluorescence aging index of dermis (SAAID) (H). These same ROI positioning was used in all images. In G and H, each bar represents the mean ± S.D. of independent measurements. The total number of ROI from which these parameters were extracted was (normal: 85 ROI for 10 images, mild OI: 19 ROI for 3 images, and severe OI: 54 ROI for 8 images). Asterisks indicate a significant (*, p<0.05) difference from normal samples. ROI mainly occupying the dermis area were used.

