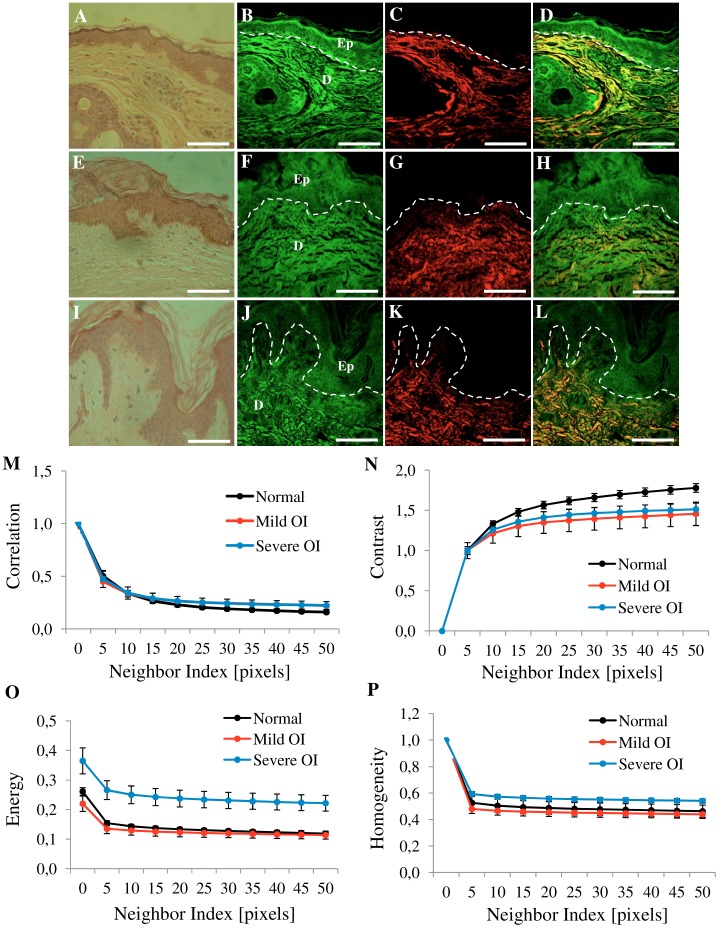
Figure 4. Texture analysis of skin dermis.
One representative image (354.30×354.30 µm) of the eight images from figure 3. Normal skin (A, B, C, D), OI-Type I (E, F, G, H) and OI-Type III (I, J, K, L). Figure shows H&E-stained samples (A, E, I), TPEF images in green (B, F, J), SHG images in red (C, G, K) and merge TPEF+SHG images (D, H, L). Epithelial/stromal interface is indicated (white outline). Ep: Epithelium, D: Dermis. Scale bars = 100 µm. Texture analysis (M, N, L, O) using the gray-level co-occurrence matrix (GLCM). Correlation (M), Contrast (N), Energy (L), and Homogeneity (O) values in dermis tissues versus distances pixels; ranging from 1 to 50 pixels (0.35 µm–17.30 µm) in 0, 45, 90 and 135 deg directions of image. (n = 12 normal, n = 3 mild OI, and n = 9 severe OI). Black line (normal), red line (mild OI), and blue line (severe OI).

