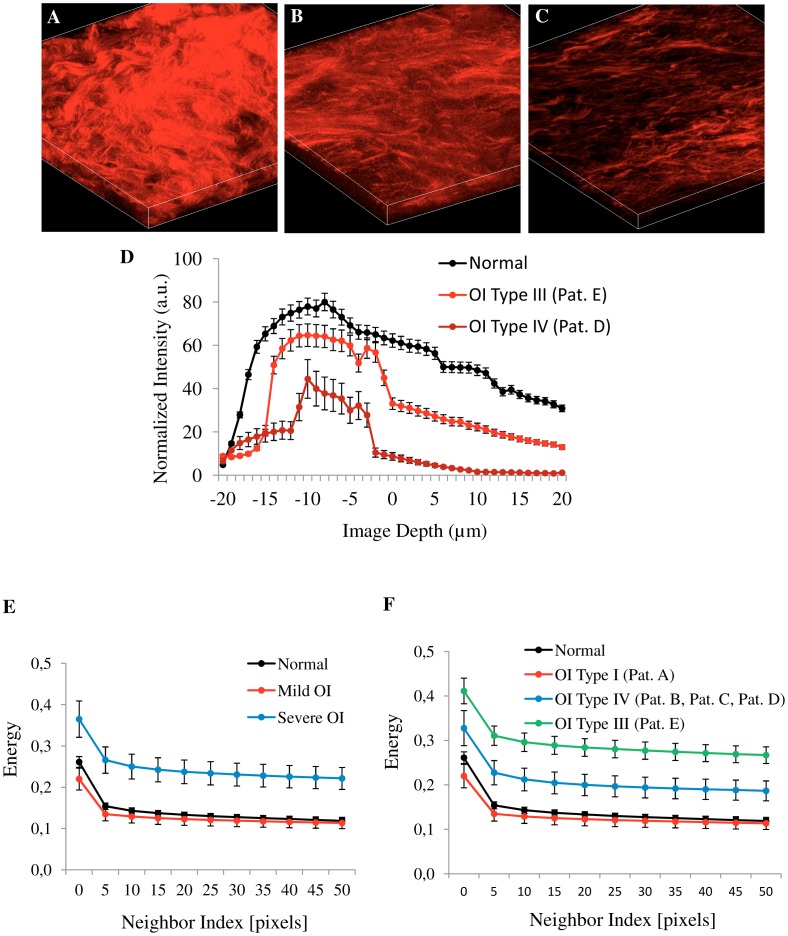
Figure 5. Best methods for quantitative analysis in fresh and fixed skin samples.
Representative 3D maximum projection (40 images at intervals of 1 µm) of SHG images from fresh skin biopsies, A: normal skin, B: OI Type III (Patient E) and C: OI Type IV (Patient D). D: depth-dependent decay of the SHG signal analyzed to determine the collagen density in normal (black circle) and severe OI (Type III and IV -red circle). White asterisk indicate the selected regions where the plot was calculated as a function of depth. Each circle represent the mean value and standard deviation of three values corresponding to selected region. Texture analysis (E, F), using the gray-level co-occurrence matrix (GLCM). Energy values was calculated in dermis tissues versus distances pixels; ranging from 1 to 50 pixels (0.35 µm - 17.30 µm) in 0, 45, 90 and 135 deg directions of image (E: n = 12 normal, n = 3 mild OI, and n = 12 severe OI; and F: n = 12 normal, n = 3 OI Type I, n = 9 OI Type IV, n = 3 OI Type III). Pat: patients.

