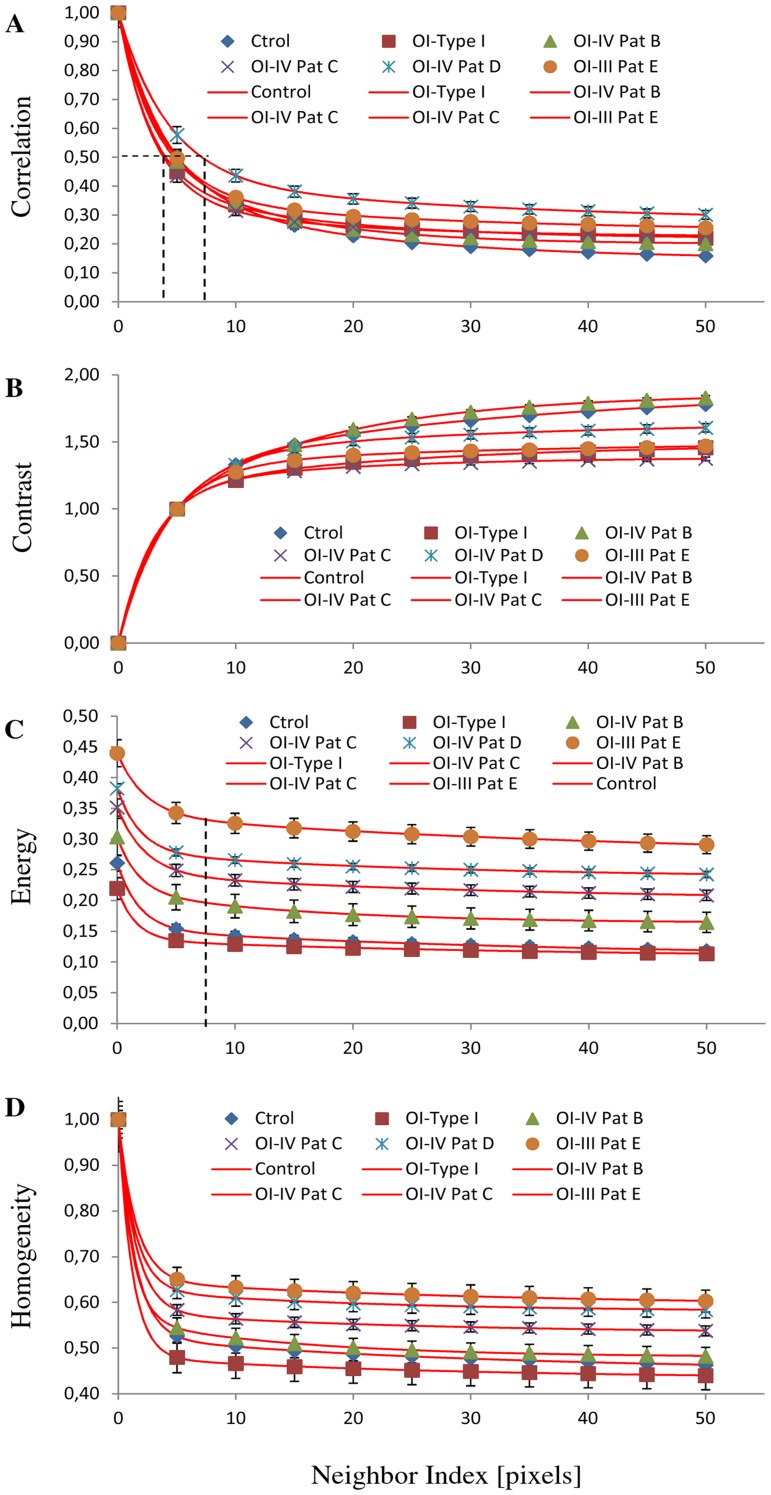
Figure 6. Texture analysis in all patients.
Texture analysis using the gray-level co-occurrence matrix (GLCM). The plots were fit (red curve) with a constant background of two exponentials using the following formula y = a0+ a1 . e (−1×/×1)+a2 . e(−1×/×2). Correlation (A), Contrast (B), Energy (C), and Homogeneity (D) values in dermis tissues versus distances pixels; ranging from 1 to 50 pixels (0.35 µm − 17.30 µm) in 0, 45, 90 and 135 deg directions of image. (n = 12 normal, n = 3 OI Type I Patient A, n = 3 OI Type IV Patient B, n = 3 OI Type IV Patient C, n = 3 OI Type IV Patient D, and n = 3 OI Type III Patient E). Pat: patients.

