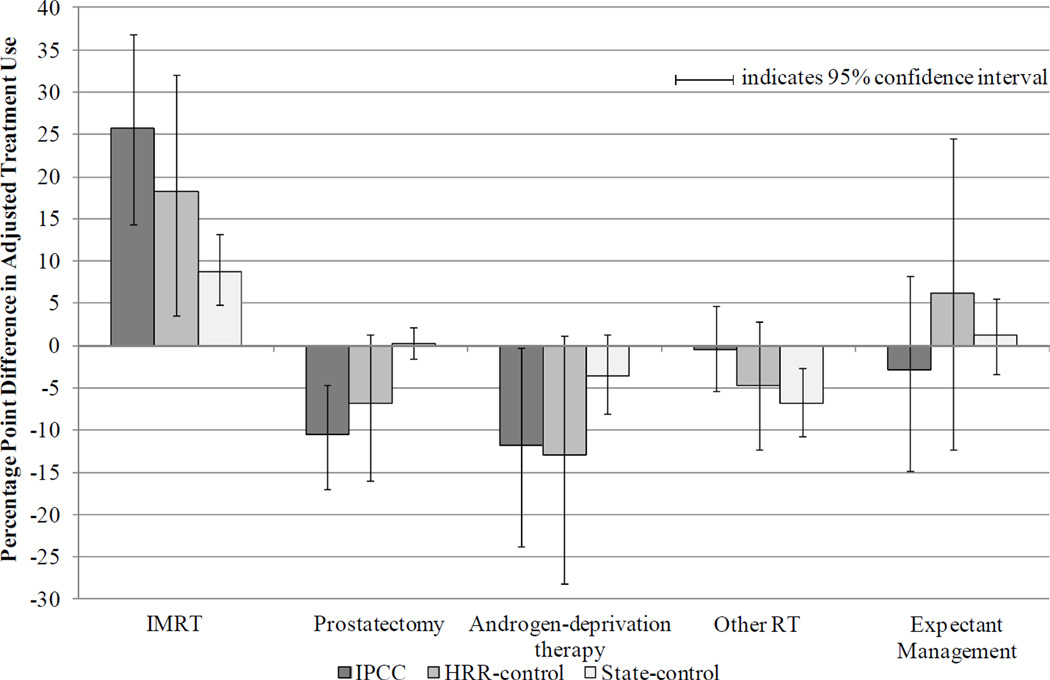
Figure 3. Adjusted Differences in Treatment Use from Before to After June 2006, by Patient Group (Patients Age > 75 years).
Note: Multinomial logit model of patients’ treatment as a function of time period, patient group, and their interaction, adjusting for patient age, race, marital status, and NCCN risk group (incorporating Gleason sum, pre-treatment PSA, and tumor stage), comorbidity, and census tract median household income. If the 95% confidence interval excludes zero, the adjusted differences between time periods are significant at the < 0.05 level.

