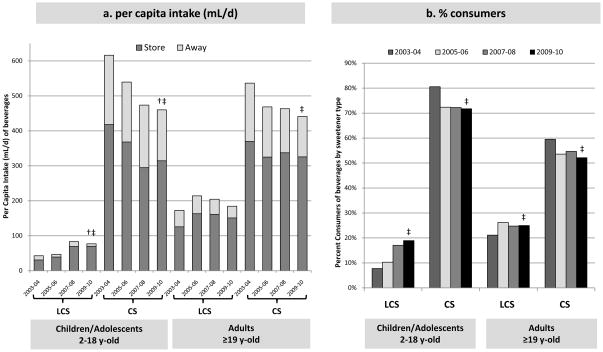
Figure 3.
a–b. Trends in consumption per capita and percent of consumers of beverages, NHANES 2003–2010*
* Trends in per capita intake of beverages (mL/d) by source of food (store vs. away-from-home); and % consumers from all sources. LCS, low-caloric sweetened beverages; CS, caloric-sweetened beverages. Multivariable linear (per capita estimates) and logistic (percent of households purchasing) regression models were used to adjust for age, gender, race and income.
† Statistically significant linear trend, Wald test, P<0.05
‡ Total beverages (store and away-from-home): statistically significant linear trend, Wald test, P<0.05

