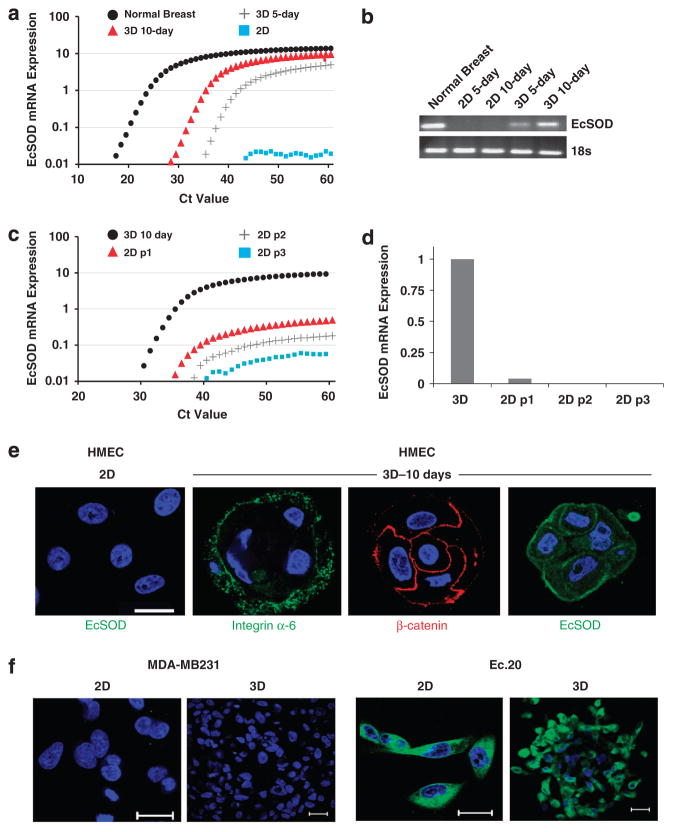
Figure 2.
Activation of EcSOD gene expression in 3D-cultured HMEC. Total RNAs were extracted from 2D and 3D-cultured HMEC for EcSOD mRNA expression analysis. (a) Quantitative real-time RT–PCR spectrum plots showing the absence of EcSOD mRNA expression in 2D-cultured HMEC and activated EcSOD mRNA expression after 5 and 10 days of 3D culture. (b) Agarose gel electrophoresis of the qPCR products further confirms the positive mRNA transcription of EcSOD in the 3D-cultured HMEC in comparison with the 2D-cultured cells. PCR products were visualized on 2% agarose gels with ethidium bromide staining. As HMEC are derived from reduction mammoplasty from individual patients, we have also obtained two additional lots of HMECs and we were able to replicate the plasticity of EcSOD mRNA expression in 3D versus 2D culture conditions. (c) After 10 days of culture in 3D conditions, HMEC acini were extracted, suspended in a single-cell suspension and plated in 2D-culture conditions. Cells cultured in 2D conditions for 3 days were subsequently trypsinized and re-plated in 2D condition for a total of three passages (p1–p3). Total RNAs were harvested at each 2D passage. The activation of EcSOD gene expression in the 3D-cultured HMEC was dramatically decreased when cells were subsequently cultured in 2D condition as indicated by the real-time qPCR analysis. 18S was used as a control for all qPCR analyses. Three separate experiments of triplicates were performed and only the representative results from one experiment were plotted in (a) and (c). (d) The bar chart shows diminished level of EcSOD mRNA expression after just one passage (p1) in 2D culture and undetectable level in the subsequent 2D passages. (e) Confocal immunofluorescence microscopy of HMEC cells cultured in 2D and 3D conditions. After 10 days of 3D culture, HMEC cells formed organized and polarized acini as indicated by the basolateral marker, integrin α-6 and the apical cell–cell junction marker, β-catenin. EcSOD immunoreactivity was not detected in 2D culture but is present after 10 days of 3D culture. Blue = nuclear staining with DAPI. (f) EcSOD expression is absent in both 2D and 3D-cultured breast cancer cell line, MDA-MB231. An EcSOD-expressing stable cell line, Ec.20 showed a strong EcSOD immunofluorescence staining throughout the cells when cultured in both 2D and 3D conditions. Representative confocal images from three separate experiments are shown here. Green = EcSOD immunofluorescence staining; Blue = nuclear staining with DAPI. Bar scale = 20 μm.

