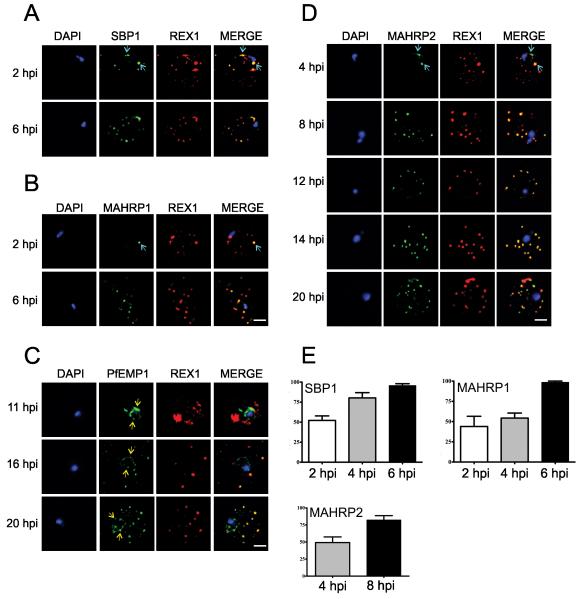
Figure 1. Immunofluorescence microscopy showing staggered delivery of different exomembrane components.
(A-D) Infected RBCs were synchronized to a 1 h window, samples were collected at 2 h intervals and smears were fixed with acetone and stained with antibodies recognizing REX1, MAHRP1, SBP1, MAHRP2 and PfEMP1 (ATS) and co-stained with DAPI. Images are presented at time points before and after delivery to the RBC cytoplasm. Scale bars = 3 μm. (E) Mean percentages ± S.E. of Maurer’s clefts (as determined by REX1 labeling) that have detectable levels of SBP1, MAHRP1 and MAHRP2. (Based on analysis of 5-10 cells).

