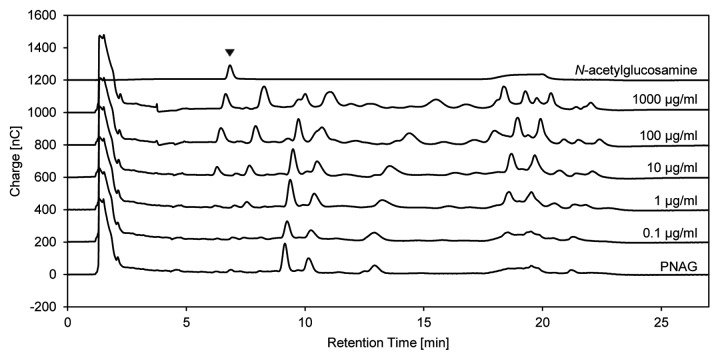
Figure 8. Total carbohydrate profile of PNAG treated with dispersin B. Soluble PNAG was incubated with the indicated concentrations of dispersin B and analyzed by HPAEC-PAD-ESI-MS. Chromatograms were recorded by PAD. Untreated PNAG and 50 µM N-acetylglucosamine were used as controls. The peak corresponding to N-acetylglucosamine is labeled with an arrowhead.

An official website of the United States government
Here's how you know
Official websites use .gov
A
.gov website belongs to an official
government organization in the United States.
Secure .gov websites use HTTPS
A lock (
) or https:// means you've safely
connected to the .gov website. Share sensitive
information only on official, secure websites.
