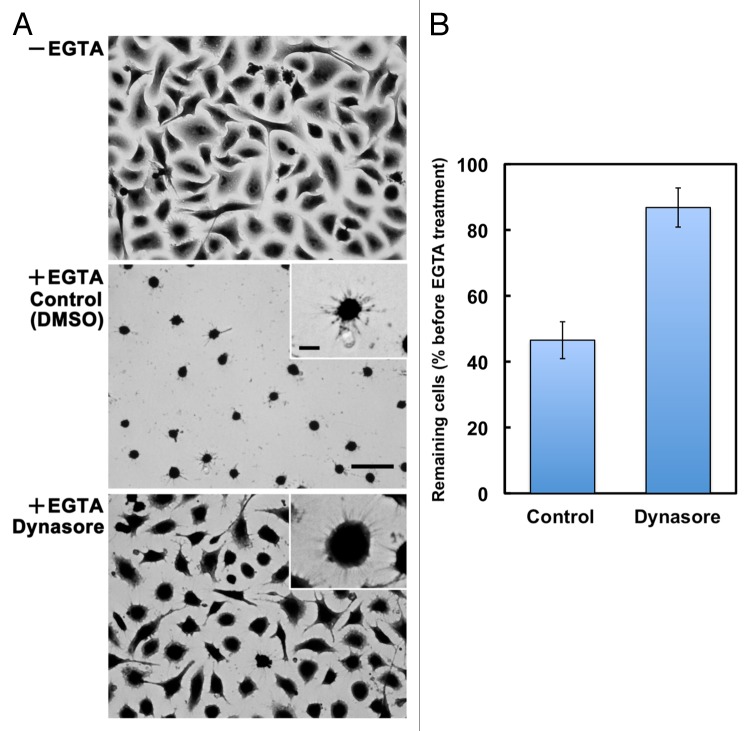
Figure 5. Involvement of dynamin activity in the formation of SAMs. (A) A549 cells were allowed to adhere to laminin-511 for 2h30min (−EGTA). Then, cells were treated with EGTA (+EGTA) for 15 min in the presence of 0.1% DMSO (Control) or 100 μM dynasore, following which they were stained with toluidine blue. Bar represents 50 μm. High-magnification images are shown in the insets (bar indicates 10 μm). (B) Cells remaining on the substrates were quantified as described in Materials and Methods. Values represent the mean ± SD (n = 3).

An official website of the United States government
Here's how you know
Official websites use .gov
A
.gov website belongs to an official
government organization in the United States.
Secure .gov websites use HTTPS
A lock (
) or https:// means you've safely
connected to the .gov website. Share sensitive
information only on official, secure websites.
