
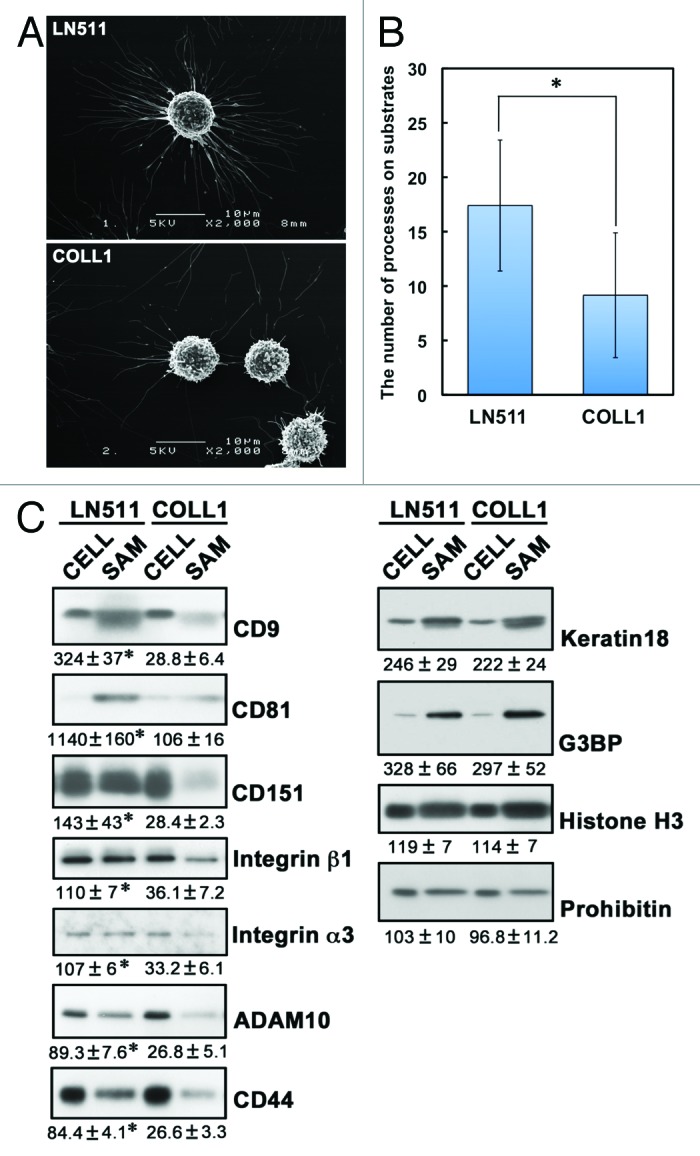
Figure 7. Differences in SAMs remaining on laminin-511 and type I collagen. (A) A549 cells were cultured on laminin-511 (LN511)- or type I collagen (COLL1)-coated dishes for 2h30min. The cells were then treated with EGTA for 15 min and fixed. Scanning electron micrographs were obtained as described in Materials and Methods. (B) The number of cell processes per cell was counted in the electron micrographs. Values represent the mean ± SD (n = 27 for laminin-511 and n = 28 for type I collagen; *p < 0.01, the Student t test). (C) SAMs were prepared following EGTA treatment of A549 cells cultured on laminin-511 (LN511) or type I collagen (COLL1) as described in Materials and Methods. Lysates (CELL) were also prepared from the cells detached by the EGTA treatment. These proteins were then immunoblotted with the antibodies indicated on the right of the blots. Data are representative of three separate experiments. The relative intensities of bands detected in SAMs to those in cell lysates are shown below the blots. Values represent means ± SD from three independent experiments. Statistical analysis was performed using the Student t test, *p < 0.05.