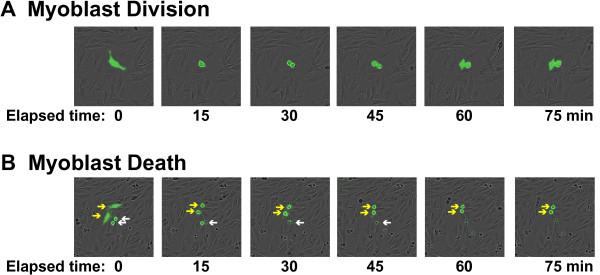
Figure 1.

Visualizing myoblast division and death. (A) Time lapse images (EGFP and bright field) at 15 min increments of an EGFP-labeled myoblast undergoing mitosis. (B) Time lapse images (EGFP and bright field) at 15 min increments of myoblast death. The arrows point to EGFP-labeled myoblasts. The white arrows indicate cells that began to die prior to the first frame, and illustrate loss of EGFP fluorescence and detachment over time of observation. The yellow arrows mark cells that condensed and underwent death during the period of observation. Loss of EGFP fluorescence and detachment occurred during the subsequent 60 min (not shown).
