Figure 2.
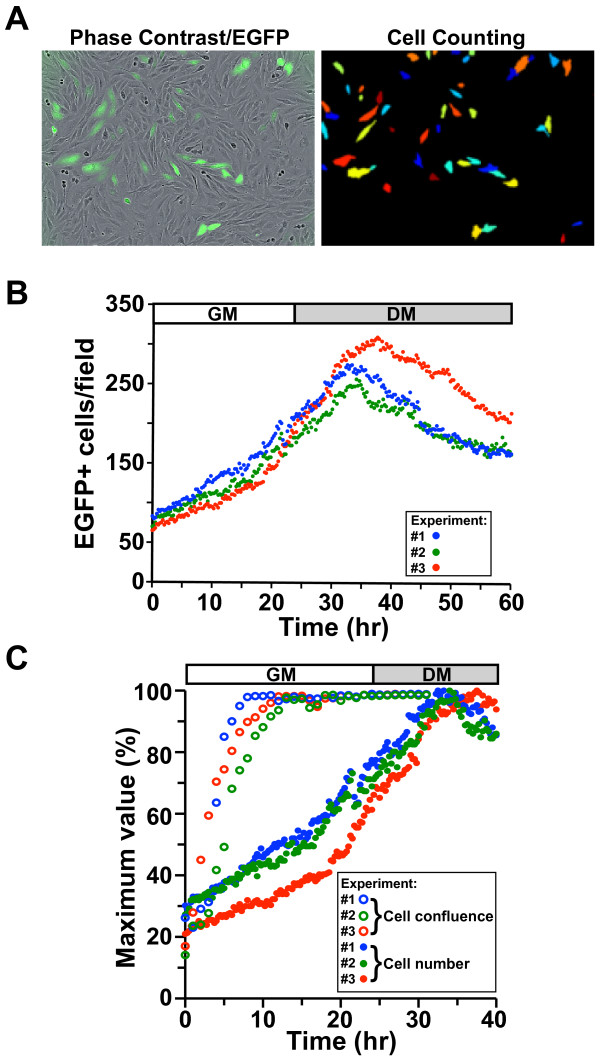
Defining myoblast dynamics by live cell imaging. C2 myoblasts were mixed at a 1:4 ratio with C2 cells stably infected with an EGFP gene under control of the EF-1α promoter, and the EGFP-expressing myoblasts were tracked at 15-min intervals using an automated cell counting algorithm. See ‘Methods’ for additional details. (A) Phase contrast image of EGFP-positive myoblasts (left) and the corresponding image of the same microscopic field with EGFP-expressing cells identified by an automated cell counting algorithm. (B) Cell number as a function of time in culture for three independent experiments (blue, green, and red). Each dot represents a single measurement. (C) Percentage of maximum cell number (closed dots) and percent confluence (open dots) as a function of time in culture for three independent experiments (blue, green, and red).

