Figure 5.
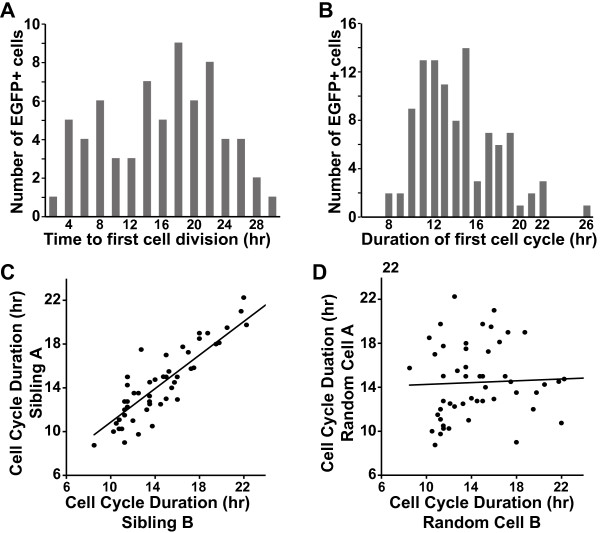
The cell-cycle duration of individual C2 myoblasts is heterogeneous. Individual EGFP-expressing myoblasts were monitored at 15-min intervals as in Figures 1 and 2. (A) Asynchronous entry of myoblasts into the cell cycle, as measured by the time from plating until the first cell division. The number of myoblasts undergoing mitosis at a given time is plotted on the y-axis. (B) Frequency distribution of the duration of the first full cell cycle. The number of myoblasts exhibiting a given cell cycle duration is plotted on the y-axis. (C) Close correlation (0.85, Pearson correlation coefficient) of cell cycle duration between siblings (progeny of the same cell division; P = 1.834e-13, t = 11.14, degrees of freedom (DF) = 49). (D) No correlation was observed for randomly paired cells (-0.07; P = 0.631, t = -0.4834, DF = 49)).

