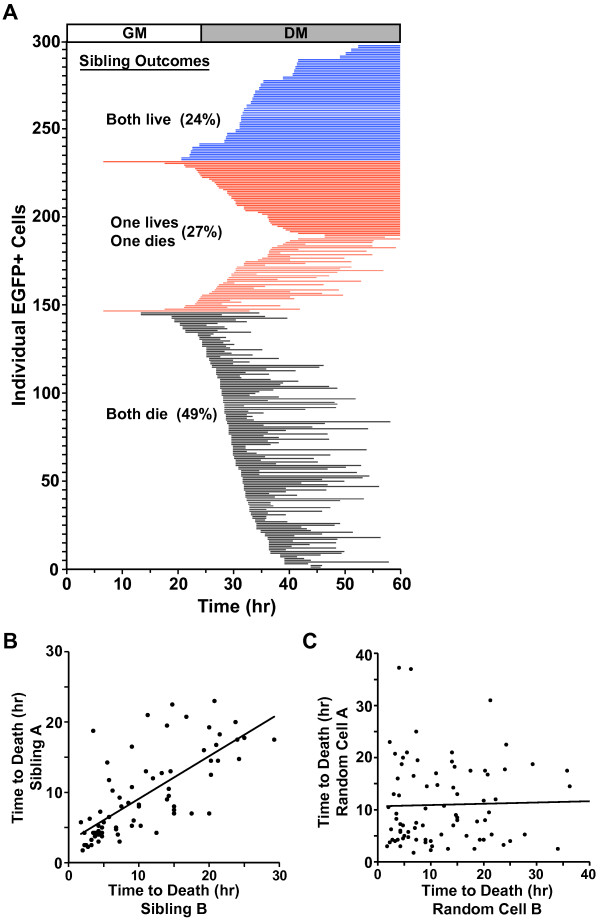
Figure 6.
Concordance of myoblast fate. Individual EGFP-expressing myoblasts were analyzed at 15-min intervals as in Figures 1 and 2. (A) The line plot shows the fate of each myoblast (n = 298). Each horizontal line indicates a survival timeline for a single myoblast with the left end representing the time after the last cell division (= starting point), and the right end indicating either the time of death or survival to 36 h in DM. Concordance or discordance of outcomes between siblings is indicated (black and blue lines reflect concordance, red discordance). The number of identical fates between siblings was significantly larger than expected by chance (χ2 = 21.064, DF = 2, two-tailed P <0.0001). (B, C) Correlation of time of cell death for siblings (Pearson correlation coefficient between sibling cells was 0.7196 (P <2.247e-12, t = 8.733, DF = 71) and between randomly paired cells was 0.1163 (P <0.3271, t = 0.9868, DF = 71)).

