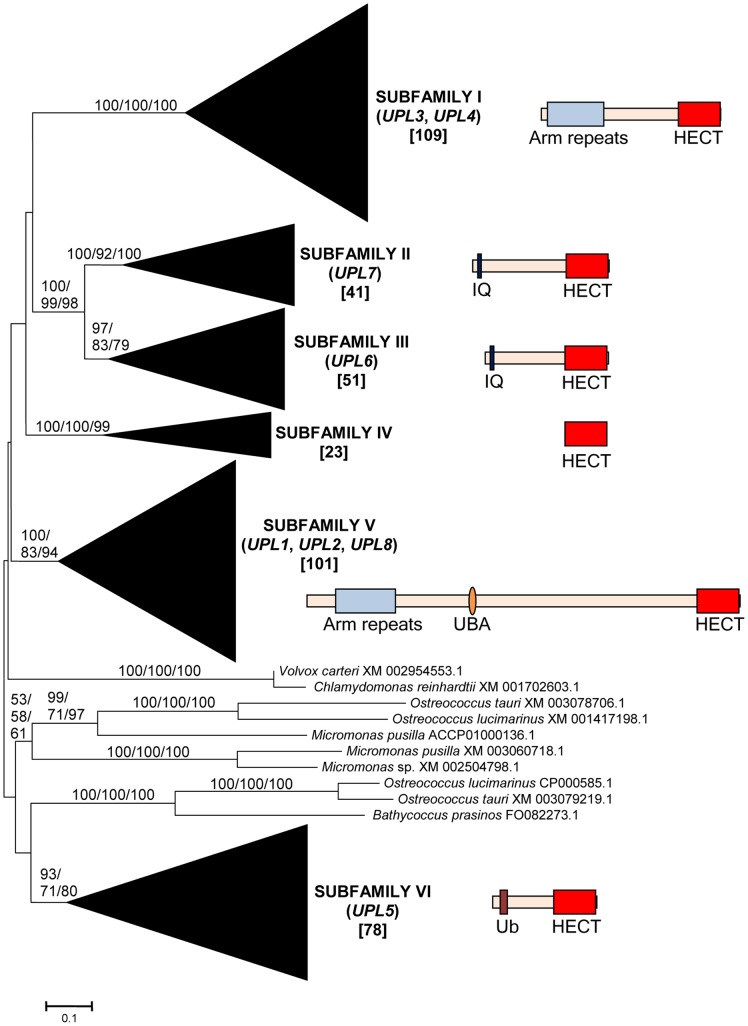
Figure 1. Basic result for the phylogenetic analysis including 413 plant HECT sequences.
The main branches that correspond to the six subfamilies (I – VI) are indicated. Only a few green algal sequences were excluded from those branches. Numbers above those branches correspond to bootstrap support, in percentages. The three numbers correspond to Neighbor-joining (NJ), Maximum Parsimony (MP) and Maximum Likelihood (ML) analyses (order: NJ/MP/ML). The names of the angiosperm genes found in each family (UPL1-UPL8) are also indicated. Subfamily IV is not present in angiosperms (see main text). Numbers in brackets refer to the number of protein sequences which are included in each branch. Only branches with bootstrap support above 50% in all three analyses are indicated. The structures typical of proteins of the different subfamilies are also indicated. In addition to the C-terminal HECT domains (red boxes), other domains can be found, as armadillo repeats (Arm repeats; in Subfamilies I and V), IQ domains (in Subfamilies II and III), UBA domains (Subfamily V) or ubiquitin domains (Ub; Subfamily VI). Proteins are drawn at scale, with the HECT domain corresponding to 350 amino acids.

