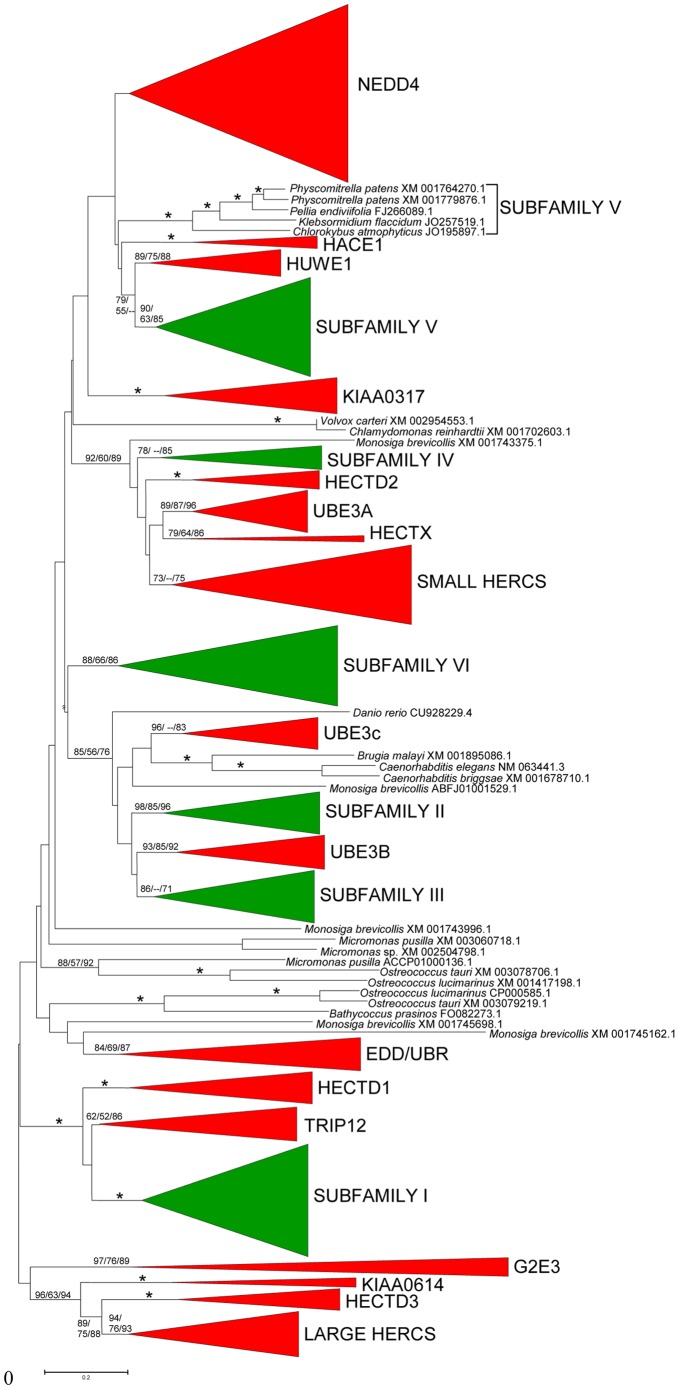
Figure 8. Phylogenetic tree comparing plant (green) and animal (red) HECT subfamilies.
Bootstrap values for the most relevant branches are indicated (again as NJ/MP/ML). Asterisk indicate branches for which the three phylogenetic analyses provided values higher than 90%. Only a few sequences cannot be ascribed to the main subfamilies.

