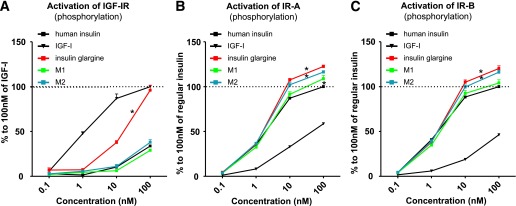
FIG. 1.

Activation of the IGF-IR (A), IR-A (B), and IR-B (C) in vitro: comparing equimolar concentrations of NPH insulin, human IGF-I, insulin GLA, and M1 and M2. Dose-response profiles ranged from 0.1 to 100 nmol/L. Points represent the mean value (+ SEM) of three independent experiments. *P < 0.05 compared with NPH insulin.
