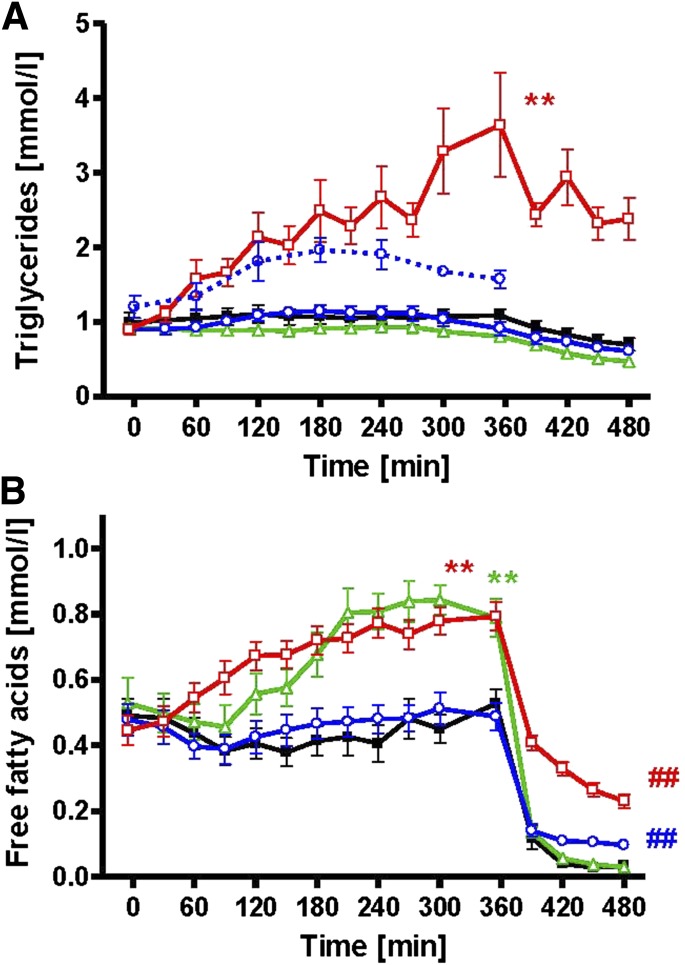
FIG. 2.
Time course of total and chylomicron triglycerides (A) and FA (B) during iv fat (red), po fat (blue), LPS (green), control (black), and triglyceride content in chylomicron fraction after po fat as broken line (blue). **P < 0.01 for AUC during intervention vs. AUC during control; ##P < 0.01 vs. control at 480 min using repeated-measures ANOVA and post hoc Dunnett testing.

