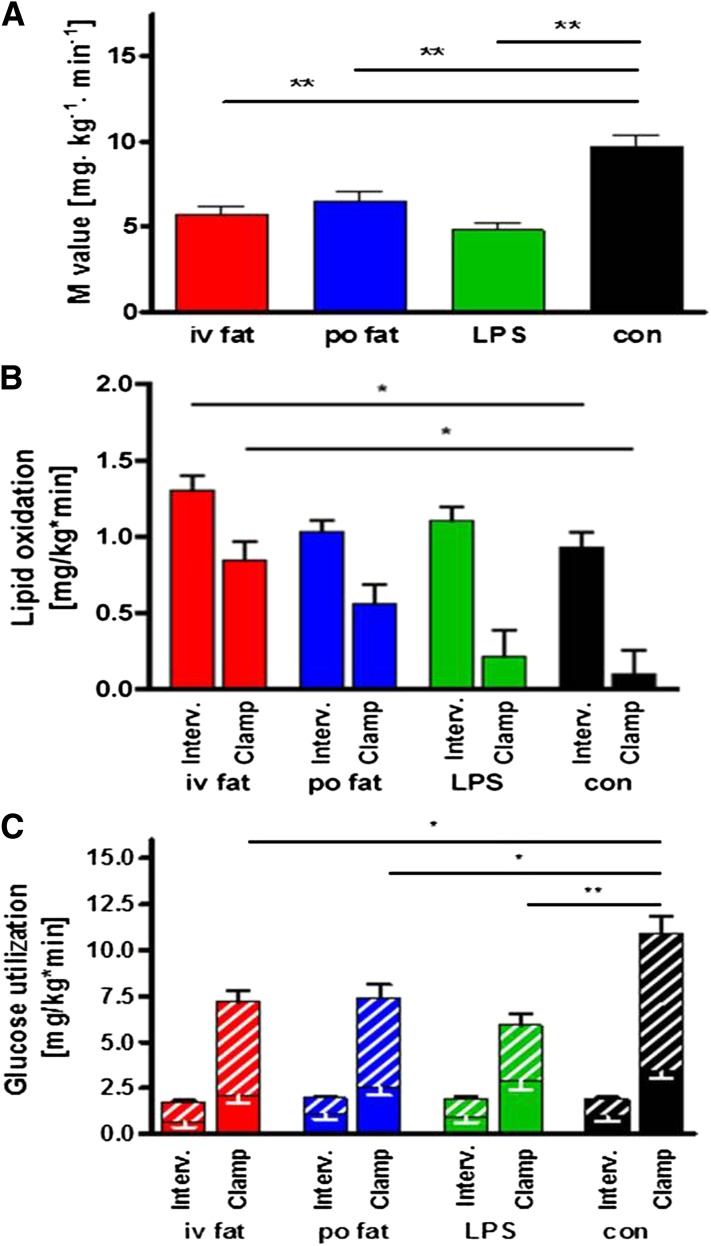
FIG. 4.
Whole-body insulin sensitivity (A) and rates for lipid oxidation (B) and oxidative/nonoxidative glucose use (C). The M-value was obtained during steady-state conditions of the hyperinsulinemic-euglycemic clamp test. Lipid oxidation and glucose use were assessed after intervention (Interv.) and during steady-state conditions of hyperinsulinemic-euglycemic clamp (Clamp). iv fat (red), po fat (blue), LPS (green), and control (con; black), and hatched bars are given for nonoxidative glucose use. Mean ± SEMs are given. *P < 0.05, **P < 0.01 vs. control analyzed by repeated-measures ANOVA and post hoc Dunnett testing.

