
FIG. 1.
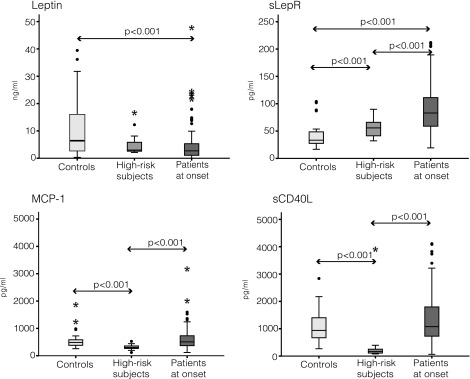
Meta-immunological profiling in patients at onset, in high-risk subjects, and in control subjects. Box plots show the distribution of circulating level of leptin, sLepR, MCP-1, and sCD40 L in type 1 diabetic patients at onset, high-risk subjects, and control subjects. Dots represent outlier values (i.e., data points below Q1 − 1.5 × IQR or above Q3 + 1.5 × IQR), and asterisks represent extreme values (i.e., data points below Q1 – 3 × IQR or above Q3 + 3 × IQR). Q1 = 25th percentile; Q3 = 75th percentile; IQR (interquartile range) = Q3–Q1. Data are shown as median (horizontal line in the box) and Q1 and Q3 (borders of the box). Whiskers represent the lowest and the highest values that are not outliers (i.e., data points below Q1 − 1.5 × IQR or above Q3 + 1.5 × IQR) or extreme values (i.e., data points below Q1 − 3 × IQR or above Q3 + 3 × IQR). Patients had lower serum levels of Lep (P < 0.001) and higher serum levels of sLepR (P < 0.001) than control subjects. High-risk subjects had intermediate levels of sLepR between children with type 1 diabetes and control subjects. Patients and control subjects had higher levels of MCP-1 than high-risk subjects; the same was observed for sCD40 L levels.