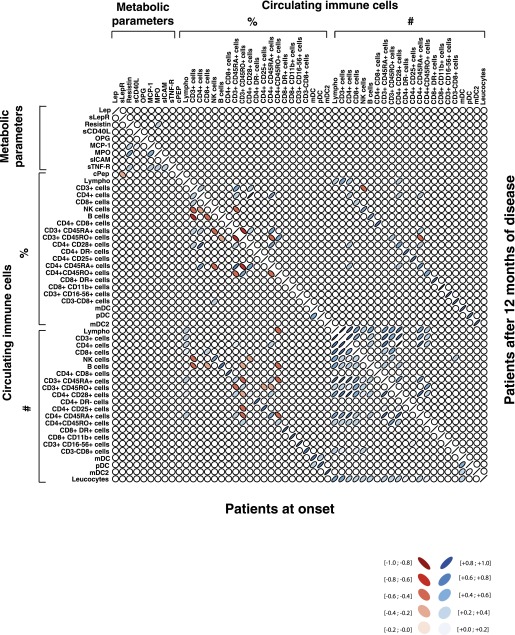
FIG. 5.
Multiple biological correlations in type 1 diabetic children over time. Two-dimensional graphical representation of the Spearman ρ nonparametric correlation matrix among the study variables. The presence of a significant correlation between two variables is expressed by means of a red (negative correlation) or blue (positive correlation) ellipse, and an empty circle refers to a nonsignificant correlation. The color intensity and the thickness of each ellipse are proportional to the correlation value (see graphic legend for numeric values). Correlation analysis, performed on all parameters analyzed, revealed a distinctive immune/metabolic profile for children with type 1 diabetes over time. The inverse correlation between sLepR and fasting C-pep, observed at disease onset, was lost 12 months later. #Absolute number of indicated cell populations with respect to the number of leukocytes; %percentage of indicated cell populations with respect to the number of leukocytes.

