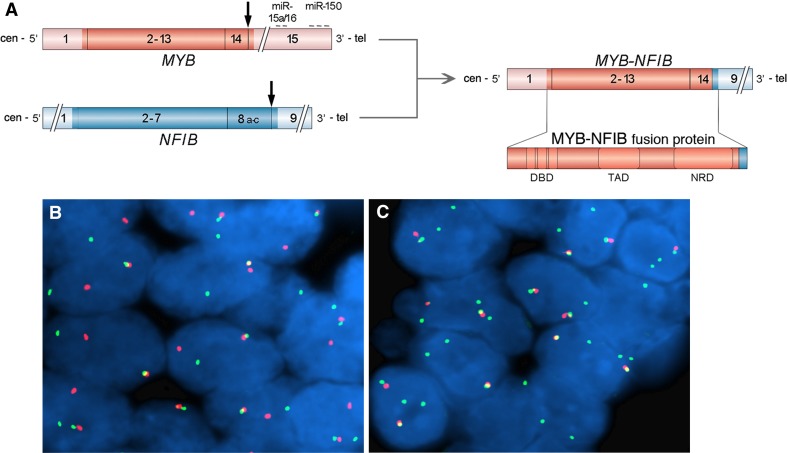
Fig. 2.
a Schematic illustration of the MYB and NFIB genes as well as the MYB–NFIB fusion oncogene (coding exons are shown i darker red and bluecolors) and the resulting fusion oncoprotein. Translocation breakpoints are shown by vertical arrows and binding sites for negatively regulating miRNAs in the 3′-UTR of MYB are indicated. DBD DNA binding domain, TAD transactivation domain, NRD negative regulatory domain. b and c FISH analysis of MYB rearrangements in adenoid cystic carcinoma using a dual-color MYB break-apart probe consisting of a centromeric (green) and a telomeric (red) probe covering the MYB locus and its flanking sequences. Interphase nuclei from a MYB–NFIB fusion-positive tumor (b), showing an intact signal (fused red/green signals) and a split signal (separated red and green signals), indicating a breakpoint within the MYB gene. Panel c shows interphase nuclei from a tumor with 1–2 intact red/green signals as well as 1–2 green signals indicating a selective gain of the MYB gene

