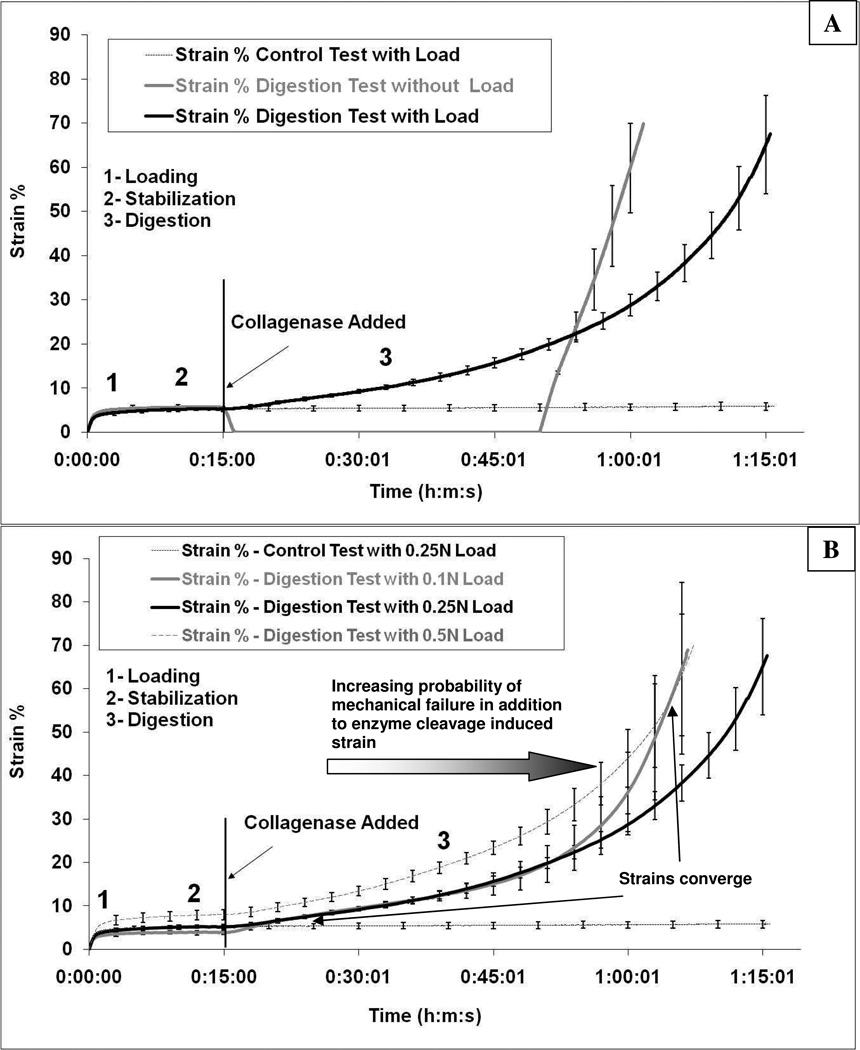
Figure 4.
Strain comparison of enzymatically-induced creep response for different protocols. A) Comparison of 0.25N continuous load to 0.25N load-unload-reload specimen. B) Comparison of continuously loaded specimens at 0.5N, 0.25N and 0.1N. The 0.25 N control experiment is included for contrast in each figure. The strains for both the 0.1N and the 0.25N samples converge rapidly within the first 5–7 minutes of the experiment (see supplementary movie as well) while the strains for the 0.1N and 0.5N samples converge at the end of the experiment. The gradient arrow in B indicates that as the strain increases, the probability of mechanical failure of tissue components increases, thus the strain increase at longer times is not purely enzymatically driven.

