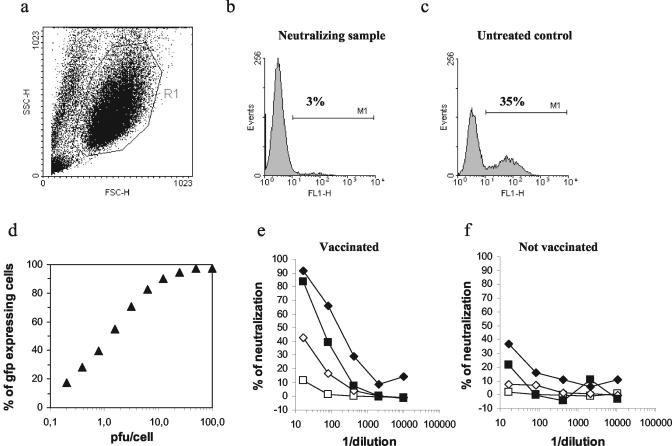
FIG. 1.
Set-up of the MVA-gfp neutralization assay. (a) Representative side scatter-forward scatter plot with a gate (R1) used to discriminate intact cells from cellular debris. (b and c) Representative histogram plots showing, respectively, a neutralizing sample and an untreated control sample. The percentages of Gfp-expressing cells are shown on each histogram plot. (d) B-LCL were infected with different numbers of PFU of MVA-gfp/cell, and the Gfp expression was measured after 14 h. (e and f) Different amounts of MVA-gfp were used in the neutralization assay (⧫ 0.5 PFU/cell; ▪, 1 PFU/cell; ◊ 2 PFU/cell; □, 6 PFU/cell), and the percentages of neutralization are shown for six serial dilutions. The same experiment was carried out with human plasma collected before (f) and 2 weeks after (e) the vaccination with MVA-nef.

