
Figure 4.
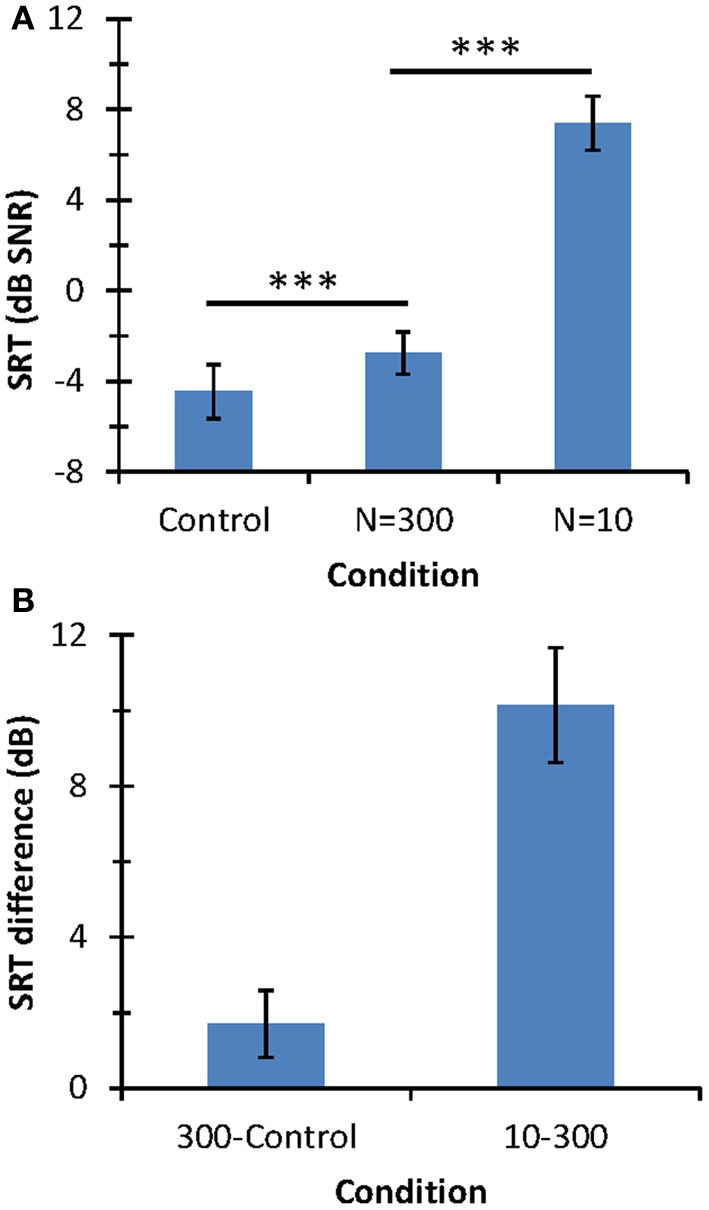
Speech-in-noise identification results. (A) Mean SRT (in dB SNR). Horizontal lines indicate the statistical comparisons made and three asterisks indicate a level of significance of p < 0.001. (B) SRT differences across conditions. In all panels, error bars illustrate one standard deviation.