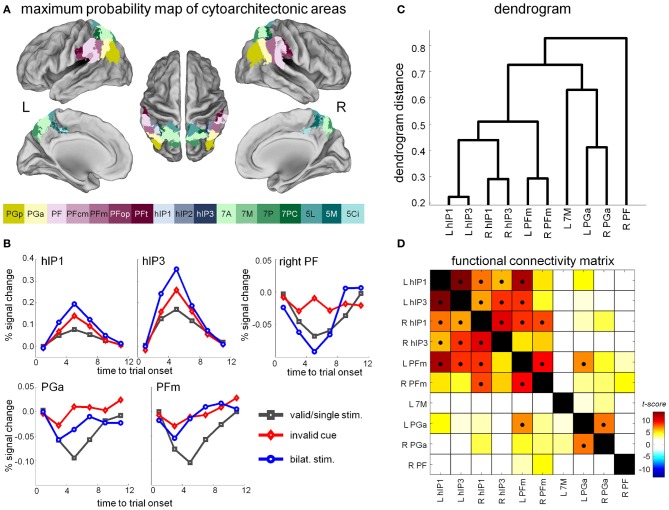
Figure 6.
(A) Maximum probability maps of parietal cytoarchitectonic areas as derived from Caspers et al. (2006). (B) Time-activity curves in a selection of cytoarchitectonic areas that showed differential effects between the competition trials, the invalid and the valid single-target trials. (C) Hierarchical clustering analysis based on the time courses during resting-state fMRI in the different cytoarchitectonic areas that showed a significant competition or invalidity effect in the hybrid spatial cueing paradigm. (D) Functional connectivity matrix. The cross-correlation matrix is sorted on the basis of the hierarchical clustering results, so that adjacent VOIs have the most similar connectivity profiles. Significant correlations (P < 0.05, Bonferroni-corrected for the number of pairwise comparisons) are indicated by a black dot.

