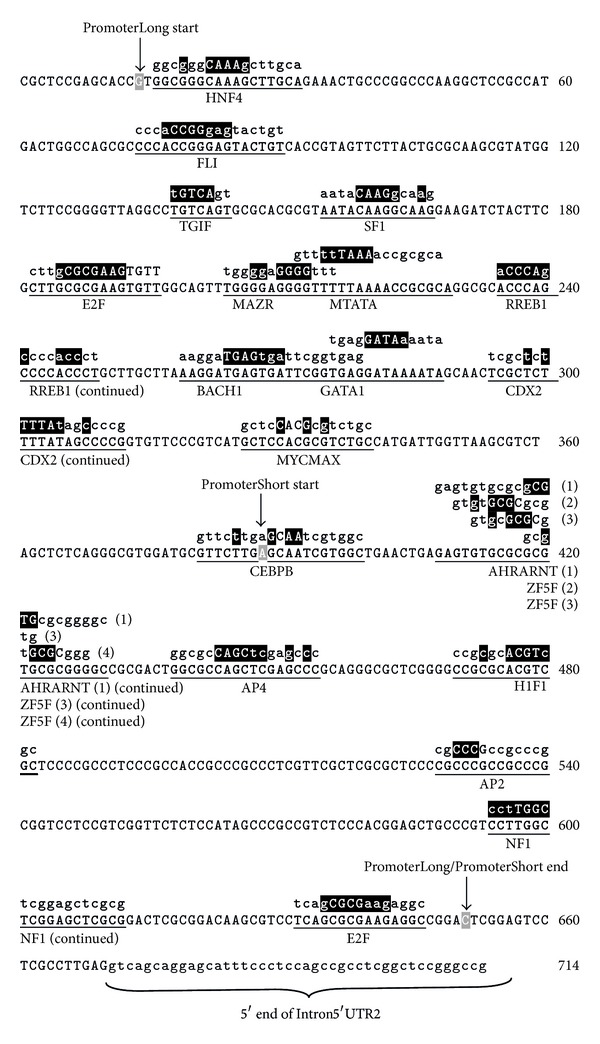
Figure 2.

Putative mouse RhoA promoter and transcription factor binding sites. The promoter region of mouse RhoA was predicted using the Gene2 promoter program (http://www.genomatix.de). The first and last nucleotides for both regions identified are in grey-boxed white text and depicted by an arrow and respective name (start, end) above the sequence. Putative cis-acting transcription factor binding sites (identified by MatInspector with a core similarity of 1 and matrix similarity above 0.8) are labelled and underlined. The nucleotides boxed in black above the consensus sequence indicate that the matrix exhibits high sequence consensus at this particular position; the nucleotides in capital letters denote the core sequence. The nucleotide numbering shown in this figure is arbitrary—the “C” nt shown at the end of the PromoterLong/PromoterShort sequences is 5′ of Intron5′UTR2 and corresponds to nt −94 of the mouse RhoA cDNA, where the “A” of the start ATG is designated nt +1.
