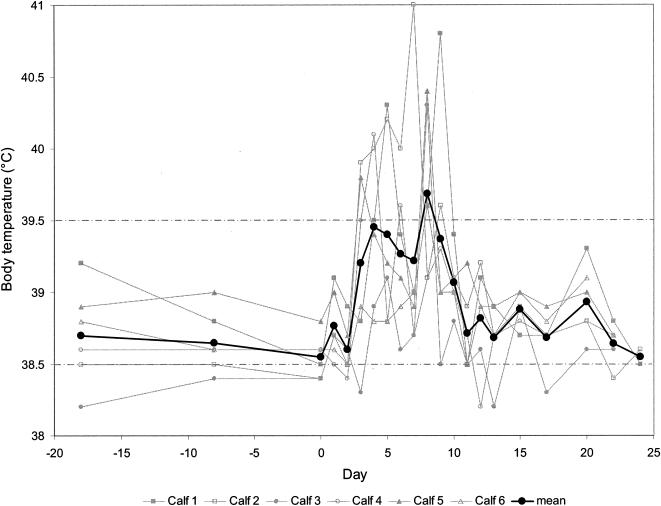
FIG. 1.
Rectal temperature of calves experimentally infected with ncpBVDV. The temperatures of the individual calves and the mean temperatures for the six calves are depicted from day 18 before infection (day −18) through day 0 (day of virus inoculation) and up to day 24 postinfection. The upper and lower physiological limits are indicated by the broken lines.

