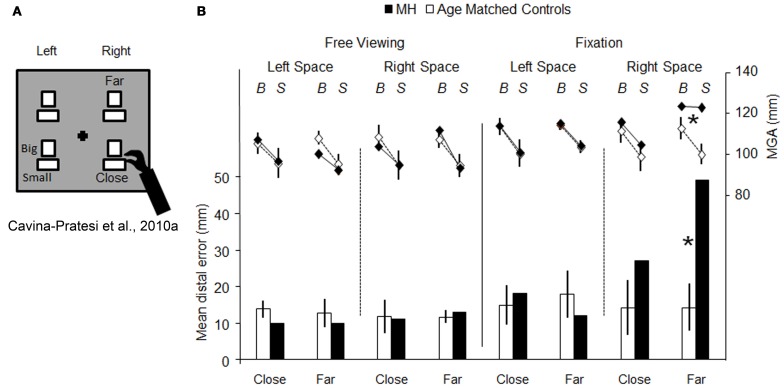
Figure 3.
Schematic representation of the set-up used for testing reaching vs. grasping behavior, and the results obtained. (A) is a schematic representation of the set-up used by (Cavina-Pratesi et al., 2010a). The black cross depicts the fixation point and the white rectangles show the possible target locations (only one target at a time was presented) and the possible sizes of the objects to be grasped (“Big” and “Small”). Patient M.H. and age-matched controls were asked to grasp objects that could be located either close to the hand (i.e., did not require any arm reaching) or far from the hand (i.e., requiring arm reaching). Graph (B) summarizes the key results for both reaching (bar graph, below) and grasping (line graph, above). The bar graph depicts the reaching error as the distance between the target and the landing position (left y axis, from 0 to 50 mm) for the left and the right arm in conditions of either central fixation or free-viewing, for both M.H. (in black) and age-matched controls (in white). It should be noted that only outward reaching toward far objects were used in the graph (for further details please see the original article). The line graph depicts the distance between the index finger and thumb (maximum grip aperture—MGA, right y axis, from 80 to 140 mm) for grasping actions extended toward big and small objects by the left or right arm in conditions of fixation for both M.H. (in black) and age-matched controls (in white). Asterisks highlight significance differences between M.H. and controls. Errors bars depict standard deviations.

